Disability is both a “lens” through which broader health policy issues can be viewed, as well as a specific set of needs of people with disabilities that health policy and systems need to address: Both prevention and management of disability are core issues in general in access to health. It is difficult to separate the interventions that are disability-specific from those that are related to health of the population in general. In this sense, disability is a lens through which health policy issues can be viewed. However, when it comes to diagnostic, screening and rehabilitative services for PWD, a disability-specific dimension enters health policy, particularly when institutional structures need to be reformed to improve access and outcomes for PWD.
In much of the world, the literature on health and disability is typically framed within a medical model: India is no exception. Thus, much of the literature on disability and health in India sees disability within a disease framework. Hence, PWD are viewed as “patients” in need of “treatment”. Empirical evidence also comes predominantly from the medical discipline, focusing on causes of disability and clinical trials; although some recent studies have focused on poverty correlates and social stigma issues that affect PWD. There is little information on access to health for PWD or their general and disability-specific health needs - except whether “treatment” was sought for the disability. Moreover, data do not allow an analysis of supply and quality of services available to PWD, and the extent to which this affects demand.
This chapter explores health issues for PWD. The structure is as follows: Section A focuses on the causes of disability in India and implications of these for public policy. It includes a brief discussion of the institutional issues with respect to heath services for both prevention and treatment of disability. This is followed by a section on the preventive aspects of disability policy, and public programs which have aimed to reduced the incidence of disability in India. This is followed by a review of evidence on health seeking behaviour of PWD. A section on the health care system and both public and non-governmental interventions for treatment of PWD follows, before conclusions and recommendations.
A. Causes of Disability in India
Chapter 1 reviewed evidence on the incidence of disability in India by disability type. It was seen that there remains considerable uncertainty on the relative shares of different disability types in the overall composition of the disabled population. This section focuses in more detail on the causes of different types of disability, using primarily NSS sources. While NSS data are subject to the caveats noted in Chapter 1, this remains a useful source of insight.
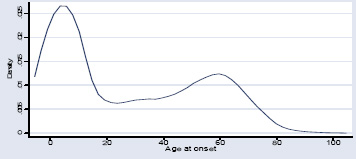
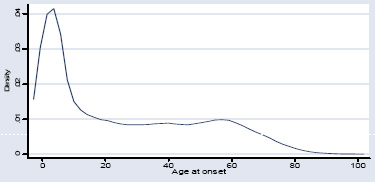
- Age of onset of disability: Chapter 1 provided cross-disability data on average age of onset of disabilities, noting the “double hump” of disability onset, first at our shortly after birth and then in the 50-60 year old cohort. However, cross-disability averages conceal as much as they reveal. The figures below provide disability-specific data on age at onset by major disability categories. The age profile of disability onset varies sharply by category of disability. Some notable patterns stand out:
- onset of mental disabilities is concentrated in childhood and 20-30, resulting in the lowest average age of onset. While more analysis is needed, it is assumed that MR is more focused on the earliest years and mental illness becomes more pronounced in young adulthood.
- in contrast, visual disabilities are much more associated with ageing, with easily the oldest mean age of onset. While hearing disabilities exhibit a more pronounced dual peak, they are also on average subject to later average onset.
- both locomotor and speech disabilities are more concentrated in younger ages also, with the highest onset in the early years of life in both cases, and a more noticeable second wave of onset for speech disabilities around age 60.
Age at onset of mental disability
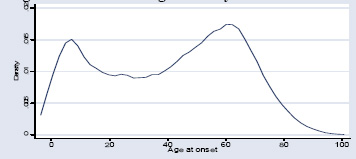
Age at onset of visual disability
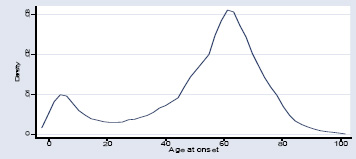
Age at onset of hearing disability
Age at onset of speech disability
Age at onset of locomotor disability
Based on Das (2006), using NSS 58th round{mospagebreak}
The age profile of onset reflects the differing structure of causes by disability category. While aggregate trends in disability cause discussed in Chapter 1 (i.e. transition from communicable to non-communicable causes, and increasing importance of injuries/accidents) are important, design of appropriate interventions also needs to focus on disability-specific profiles of causes. Critical periods for intervention for locomotor and speech disabilities are particularly in early childhood. For mental disabilities, the critical period for MR is also early childhood, while for mental illness, adolescence and early adulthood are key. For hearing impairments, screening throughout life seems important, but especially as people age, and for visual disabilities, the focus period is during a person’s 50s and early 60s. Overall, the importance of early identification and intervention can not be stressed enough. The specific conditions are discussed in turn below.
The main causes of visual disabilities are presented in Table 3.1, and are primarily age-related, with cataract and other age-related issues being the chief causes. The major share of visual disability is thus preventable and occurs due to lack of treatment. In a national estimate, Dandona et al estimate that almost two-thirds of blindness is preventable or treatable. If there is no change in the current trend of blindness, the study estimates that the number of blind persons in India would increase to 24.1 million in 2010, and to 31.6 million in 2020. If effective strategies are put in place to eliminate cataract, blindness in 15.6 million persons would be prevented by 2020, and 78 million blind person-years. Similarly, if effective strategies are implemented to eliminate refractive error blindness and corneal disease/glaucoma, another 7.8 million persons would be prevented from being blind in 2020, and 111 million blind person-years.
Table 3.1: Causes of Visual Disabilities (for Individuals with Single Disability (i.e Visual Only)
| Cause | Percent |
| Cataract | 23.4 |
| Old age | 23.0 |
| Corneal opacity/other eye errors | 20.0 |
| Not Known | 9.8 |
| Other | 5.6 |
| Glaucoma | 5.3 |
| Burns or injury | 4.7 |
| Small pox | 4.1 |
| Medical/surgical intervention | 2.6 |
| Childhood diarrhea | 0.7 |
| Sore eyes after first month | 0.9 |
Source: Das (2006), based on NSS 58th round.
The major cause for both speech and hearing disabilities is illness and disease, or in the case of speech disability, is not known. In addition, over 21 percent of all hearing disabilities are due to old age. The importance of non-specific causes in these categories (other illness, other, not known in the case of speech disabilities) highlights that disability is intrinsically related to other public health issues, and that increasing access to better quality care is an important step towards reducing disabilities. This has implications not only for prevention but for diagnostic facilities and technology, and referral and rehabilitation services.
Table 3.2: Causes of Hearing and Speech Disabilities - 2002
| Percent | Cause - Hearing Disability | Cause - Speech Disability | Percent |
| 21.3 | Old age | Voice disorder | 12.6 |
| 18.6 | Discharge | Paralysis | 11.9 |
| 8.7 | Other | Other | 8.3 |
| 5.3 | Burns and injury | Burns and injury | 0.9 |
| 2.1 | Noise | Cleft palate | 4.5 |
| 1.6 | Medical / surgical intervention | Medical / surgical intervention | 3.8 |
| 0.7 | Rubella | Mental illness | 2.8 |
| 0.01 | Not Known | Hearing Impairment | 1.6 |
| 23.0 | Other illness | Old age | 1.1 |
| Other illness | 25.2 | ||
| Not Known | 21.7 |
Source: Das (2006), based on NSS 58th round.
Locomotor disability is the category which is undergoing the most rapid change in causal profile. As Table 3.4 shows, for the current group of locomotor disabled people, polio remains the highest single cause, accounting for almost a third of all locomotor disability. However, burns and injuries are also a major share, and once more non-specific causes account for over 20 percent of total. As will be seen, progress in reduction of new polio cases has been a public health success stories in India in recent years, so that the causes of locomotor disability are shifting significantly.
Table 3.4: Causes of Locomotor Disability - 2002
| Cause | Percent |
| Polio | 30.9 |
| Burns and Injury | 28.5 |
| Other illness and disease | 12.7 |
| Stroke | 6.3 |
| Not Known | 4.5 |
| Other | 4.5 |
| Arthritis | 3.0 |
| Old age | 2.8 |
| Leprosy | 2.2 |
| Medical / surgical intervention | 2.2 |
| Cerebral Palsy | 2.1 |
| TB | 0.4 |
Source: Das (2006), using NSS 58th round
As noted in Chapter 1, estimates of mental disabilities in India remain particularly problematic. This is driven by various challenges, including identification skills of health providers, families and surveyors, and stronger social stigma attached to such conditions. With such a caveat, the NSS-identified causes of mental disabilities are presented in Table 3.4, and more than any other category highlight that causes of mental disabilities remain little understood in India. As noted, research by mental health organizations has found much higher rates of mental disabilities, with for example a meta-analysis estimated the prevalence of mental illness at 5.8 percent of the population. 3 Equally, suicide rates in India have risen significantly since the 1980s, from 7.5 to 10.3 per 100,000 population between 1987 and 1997. 4 Suicide rates also have notable state variations, with pockets of high prevalence for suicide, for example, in Kerala, West Bengal and Tamil Nadu. Addressing mental health issues during and after disasters has also come into focus after the Bhopal gas leak, earthquakes in Marathwada and Gujarat, and more recently the tsunami for 2004.{mospagebreak}
Table 3.5: Causes of Mental Disability - 2002
| Other | 41.65 |
| Not known | 36.31 |
| Serious illness in childhood | 11.97 |
| Head injury in childhood | 3.83 |
| Heredity | 3.17 |
| Pregnancy / birth related | 3.01 |
Source: Das (2006), using NSS 58th round
A further cross-disability issue that is likely to assume greater importance over time is the prevalence of accidents and injuries as a cause of disability. Table 3.5 provides insights by gender from 2002 on where such accidents occur. Overall, using NSS sources, accidents and injuries have some role in around 18 percent of all disabilities. There are, however, major gender differences in the source of such injuries. For males, over 35 percent of these injuries are at the place of work, while for women, the overwhelming proportion – 60 percent - are in the home.
In addition, around 27 percent of male and 14 percent of female burns and injuries happen in transport accidents, confirming data from other sources of a major impact of road traffic accidents on disability in India. A recent study estimated that 1.2 million people are seriously injured and around 300,000 permanently disabled in road traffic accidents each year in India, often through failure to take simple precautions such a wearing seatbelts or wearing motorcycle helmets.6 In terms of economic impact, a 2002 Planning Commission report estimated that road accidents cost India around Rs. 55,000 crore in 2000 prices. Just as importantly, the trends are discouraging. A recent WHO/World Bank international report found an almost 80 percent increase in road traffic fatalities in India between 1980 and 1998. The largest group of such fatalities are pedestrians, among whom the poor are likely to be over-represented. This can be seen in Table 3.6 for Delhi, Mumbai and on highways from 11 Indian locations. Micro-studies confirm that the poor are at higher risk of pedestrian injuries, and that a high share of injuries of pedestrians are due to buses.
Table 3.6: Proportion of road deaths by types of user and location
| Location | Type of road user (%) | ||||||||
| Lorry | Bus | Car | TSR | MTW | HAPV | Bicycle | Pedestrian | Total | |
| Mumbai | 2 | 1 | 2 | 4 | 7 | 0 | 6 | 78 | 100 |
| Delhi | 2 | 5 | 3 | 3 | 21 | 3 | 10 | 53 | 100 |
| Highways | 14 | 3 | 15 | - | 24 | 1 | 11 | 32 | 100 |
Source: Mohan (2002), cited in WHO/World Bank (2004). TSR = three wheel scooter taxi; MTW = motorized two wheelers; HAPV = human and animal powered vehicles. Highways from 11 locations (not including tractor fatalities)
No credible data are available to ascertain the outcome of accident survivors; it is generally perceived that outcomes in patients with single system injury (e.g. musculoskeletal trauma) have improved, but not for polytrauma. There is a high mortality rate amongst those with multi-system injuries, due to the primitive state of trauma-care systems, lack of pre-hospital care and inadequate critical care, especially in rural and small urban areas.{mospagebreak}
While the above analysis provides some insights into the medical, environmental and social causes of disability, it is equally important to understand what weaknesses in health delivery (and other) systems contribute to disability outcomes in India. It is clear that effective interventions need to be across sectors beyond health, including nutrition programs for children and mothers, workplace and home safety, traffic management, water and sanitation, and other environmental areas. Sections B and C explore this in more detail for both preventive and treatment/rehabilitation services. These are preceded by a discussion of some elements of health seeking behaviour among PWD.
Table 3.7: Place of Incident for Burns and Injuries by Sex for PWD – 2002
| Male | Female | |
| Agricultural field | 18.4 | 9.4 |
| Mines | 0.6 | 0.4 |
| Factory | 3.6 | 0.9 |
| Other work site | 12.8 | 4.8 |
| Transport accident | 26.9 | 13.8 |
| Home | 24.4 | 59.3 |
| Other | 13.2 | 11.1 |
Source: Das (2006), using NSS 58th round
Prevention of Disability
A large proportion of disabilities in India are preventable, including disabilities that arise in the circumstances surrounding birth, including maternal conditions, from malnutrition, and from causes such as traffic accidents or workplace injuries. The many causes of disability, and the unclear genesis of some disabilities, make it difficult to define comprehensively the scope of interventions and public policies that impact the level and nature of disability in India. This section therefore focuses selectively on a sub-set of public interventions. Some of them, such as India’s campaign against polio, can be considered success stories of the public health system. Others, such as comprehensive immunization, display trends which are worrying both in terms of disability and mortality. A common issue with many preventive public health initiatives is the mode of national campaigns and how these work in a context of increasingly devolved responsibility for various aspects of the health delivery system.
a) Immunization Programs: India has long had vertical programs that address comprehensive immunization according to international norms of the Universal Programme for Immunization. Immunization affects mortality, morbidity and disability. Measles in particular is associated with blindness, and other vaccine preventable illnesses predispose infants and children to other diseases which may in turn cause long-term disability. Recent data from the Reproductive and Child Health (RCH) surveys show what may be a disturbing trend (Figure 3.1). While coverage of polio has progressed remarkably (see below), there appears to have been an overall decline in immunization rates at the national level, with the most serious decline evidenced in the north eastern states.10 On a national basis, full immunization coverage has declined from 54.2 to 48.5 percent in only around 5 years, a fall from an already low base. While a number of states have sustained or slightly increased high coverage rates (e.g. TN, Punjab, Karnataka), there are worrying declines in coverage rates in both the NE and some larger states (e.g. MP, UP, Jammu and Kashmir, Rajasthan). However, a caveat is in order. NFHS data from 1998/99 for a number of states – including several poor states - give dramatically different coverage rates to RCH-1 data (e.g. UP, Orissa, MP, Rajasthan, Assam and AP), suggesting that issues of sampling need careful examination in assessing trends. Nonetheless, it seems reasonable to say that India’s immunization performance has at best stagnated in recent years and most probably declined in a sizeable portion of the country.
Figure 3.1: Full Immunization coverage rates by state, 1998/99 and 2002/04
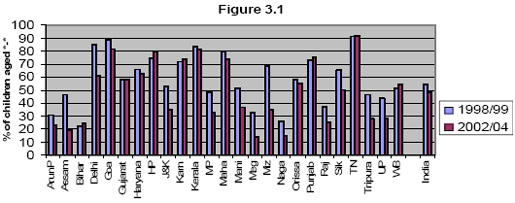
Source: RCH surveys.
b) Polio eradication: The above data relate to full coverage immunization. However, with respect to disability, the story of recent years has positive elements as well, perhaps the most high profile being progress against polio through the Pulse Polio Immunization campaign (PPI). In order to reach the global goal of zero incidence of polio, a strategy to intensify PPI was adopted in 1999-2000. It consisted of four nation-wide PPI rounds in late 2000-early 2001; followed by two sub-national rounds in Assam, Bihar, Gujarat, MP, Orissa, Rajasthan, UP and West Bengal, plus routine immunization, especially in poor performing States.
Figure 3.2: Number of poliomyelitis cases, by month and year – India, January 1998- May 2005
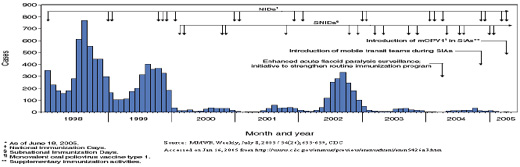
Results of PPI in the last decade have been dramatic, though the nature of the virus also results in cycles of new cases. The Centers for Disease Control (CDC) report that in India there were 135 polio cases with onset of paralysis in 2004, and for 2005, India reported only 66 polio cases with onset of paralysis for the year: mostly in Bihar and UP. This compares to several thousand cases per year as recently as 1998, and much higher rates previously (Figure 3.2). At the same time, numbers went up again in 2006, in part due to the cyclical nature of the disease, which tends to peak in 3-4 year cycles (and within each year in the earlier months of the year). From only 66 cases in 2005, there were 674 cases in 2006, mostly in UP (546 cases) and Bihar (61 cases), though date for the first quarter of 2007 indicates better outcomes, with only 44 cases to end March. 11 The polio laboratory network remains one of the strongest components of India's polio eradication program, providing significant support to vaccine and surveillance efforts. The laboratories provided rapid results in 2004, even though more than twice as many specimens were tested as in 2003. The authorities are optimistic that polio can be eradicated in India, though the fact that it is endemic raises major challenges in sustaining recent efforts. The continued commitment to polio eradication is clear in the FM’s 2007/08 budget speech, which outlines a targeted strategy in high risk districts of UP and Bihar, and use of monovalent vaccine which is more effective in combating the strain of polio which continues to cause most new cases. A second question raised by some public health players is the sense that other immunization and public health initiatives may have suffered as a result of the intense focus on polio eradication.
National Blindness Control Programme (NBCP): The NBCP was started in 1982 and is one of the largest disability prevention programs. It undertakes activities like general eye care, cataract surgery, correction of refractive errors etc. However, cataract surgery is the main indicator used to evaluate success, and annual outcomes in terms of surgeries have expanded impressively since the mid-1980s (Table 3.8). At the same time, unit costs have risen steeply, not only due to general price inflation, but also due to use of more costly technology such as intra-ocular lenses and more advanced eye theatres.
The NBCP, like other vertical programs functions at the apex through a National Programme Management Cell in MoH, State Ophthalmic Cells, tertiary Regional Institutes of Ophthalmology and Eye Hospitals, and at the district level through District Blindness Control Society and District/Sub-District Hospitals. In order to address problems of outreach in rural areas, the Programme has tried to expand accessibility of ophthalmic services. It sponsors central and district mobile units which conduct mobile eye camps and performance of cataract surgery. Most cataract operations in rural areas are conducted through mobile camps. Primary health centers have also been equipped with ophthalmic equipment and by posting para medical ophthalmic assistants. However, by its own admission, the Program’s main challenges is to expand activities beyond cataract surgeries to focus on other causes of blindness, improve quality of services and post-surgical follow-up, strengthen human resource development and outreach/public awareness.{mospagebreak}
Table 3.8: Cataract Surgeries under the National Blindness Control Programme
| Year | Cataract Surgeries (lakhs) | Expenditure (Rs. in crores) |
| 1985/86-1989/90 | 58.78 | 28.91 |
| 1990-91-1994/95 | 83.9 | 93.27 |
| 1995-96-1999/00 | 114.52 | 333.32 |
| 2000-'01 | 36.7 | 109.7 |
Source: Ministry of Health 2005
National Leprosy Eradication Programme: Started initially in 1954-55 as the National Leprosy Control Programme, the increased focus led to its renaming as the National Leprosy Eradication Programme (NLEP) in 1983 with the objective of eliminating leprosy (i.e., reducing the caseload to less than one case per 10,000 population). In 1993-94, the first National Leprosy Elimination Project was started on a national scale, using multi-drug therapy (MDT), strengthening existing services, intensive health education, trained manpower development, disability prevention and care including reconstructive surgery. The second phase of the project decentralized implementation to States/UTs and districts, and integration into the overall health system. Recently there have been nationwide Modified Leprosy Elimination Campaigns with intensified community IEC and better outreach.
Progress in leprosy reduction has been impressive. In 1981, India had a prevalence of 57.6 leprosy cases per 10,000 population. As of early 2004, this had fallen to 2.44 cases, though with strong statewise concentration in UP, Bihar, Maharashtra and West Bengal. Seventeen States/UTs have eliminated leprosy, including large states such as Rajasthan. Another seven States/UTs are close to this goal of leprosy elimination (with current prevalence of 1-2/10000), including MP, Karnataka, Gujarat, AP and Tamil Nadu. As of early 2006, GoI reports that leprosy has been almost eliminated nationally.
In other preventive programs however, the authorities have struggled to find effective modes of intervention. An example is the National Filaria Control Program (NFCP) 13. Launched in 1955, official reviews revealed very limited impact. The program was then withdrawn from rural areas. A revised strategy for control in endemic states was launched in 1996-97. Four main areas were targeted under the revised strategy: (i) single day mass drug administration; (ii) referral services at selected centres; (iii) Information-Education-Communication (IEC) in the community; and (iv) anti vector measures in all urban areas.
Despite these efforts, only about 11 percent of those living in endemic areas of India fall within an active control program, with particular shortfall in rural areas. The major constraints of the program are: (i) detection of carriers by night blood surveys which is costly and poorly accepted by the community; (ii) poor perception of the disease and the benefits of the control program; and (iii) drug compliance was not at a level to interrupt transmission in many states.
(e) Prevention in the general health care system: The above experiences indicate some success in India is reducing the incidence of disabling communicable diseases. However, successes in reduction of some communicable diseases have not been matched by progress in the broader public health system in several key areas which have significant impacts on disability. One example is in programmes addressing micronutrient deficiencies, where India maintains the “South Asian curse” of stubbornly poor nutritional outcomes for its population. Irreversible debilities can arise from both mother’s anemia and in nutritional deficiencies in childhood, and children from poor families are at particular risk (e.g. vitamin A deficiency is a cause of blindness; iodine deficiency disorders (IDD) are preventable causes of mental retardation). National programs to deal with iodine, iron and Vitamin A deficiency have been in existence for some time. Despite this, UNICEF reports that approximately only 45 percent children from 6-59 months were covered by Vitamin A supplementation in 2003 and only half of all households consumed iodized salt in the period 1998-2004.14 However, IDD is a problem in every part of India. Of 286 districts in the endemic states surveyed by the Ministry of Health and Family Welfare in 1998, IDD was endemic in 242. 15 Coverage of these programs is intrinsically related to coverage of other maternal and child health programs and draws attention to the links between overall health goals and prevention of disability. In this regard, a positive development in 2005 was the re-banning of non-iodized salt by GoI.
Children from poor households are at greater risk of malnutrition-induced disabilities. In addition, CWD may also be at greater risk of malnutrition if their there is relative neglect of their feeding, and/or their disability contributes to problems with feeding. Findings of a study exploring the impacts of malnutrition among children in the Dharavi slum of Mumbai show:
- mean weight for age of children with disabilities was significantly lower compared to their siblings.
- CWD had significantly lower mean hemoglobin levels compared with siblings.
- CWD with feeding difficulties were significantly more likely to be malnourished using all indicators, compared to disabled children without feeding difficulties.
A second critical area of the general health system that has major impacts on minimization of disability is reproductive, maternal and child health. This relates not only to young children themselves but also to mothers. There is a large body of literature that underscores the importance of maternal factors such as education, nutrition and health care for child health outcomes. However, access to care during pregnancy and delivery is poor in India. In the three years preceding India's National Family Health Survey 1998-99 (NFHS-2), only 35 percent of pregnant women received no antenatal care: a marginal improvement on the 36 percent in the 1992-93 NFHS. The survey showed that the women who failed to seek care tended to be older (ages 35 to 49), with a high number of previous pregnancies, and were illiterate and socio-economically disadvantaged. Other micro-studies confirm these patterns. Such maternal characteristics tend also to be associated with higher risks of disability in children. The UP and TN survey also provides support for the importance of ante-natal care. Mothers of CWD were almost three times more likely to have had difficulties during pregnancy, indicating a much higher than average need for ante-natal care. They were also significantly less likely to have accessed government allopathic ante-natal care when they did (and more likely to have used public traditional or private providers).
Disability arising from maternal causes is difficult to assess and estimate, but it is well-known that low-birth weight, prematurity, maternal anemia, and malnutrition increase the risk of disability among babies. For example, neural tube defects (NTD) a condition that leads to considerable and irreversible disabilities in newborns can be prevented by including folic acid supplements in pregnant women’s diet. The prevalence of NTD is reported to be 3.63 per 1000 live births and the highest being in the northern states of Punjab, Haryana, Rajasthan and Bihar.
Apart from impacts on the child, poor access to quality services can result in a range of disabling conditions for mothers themselves, some of which are easily treatable conditions such as fistula which can become disabling if not attended to. Information on women with disabilities (WWD) and their reproductive health needs in India is limited. Among the most severe of these disabilities are the conditions resulting from obstructed labour, conditions virtually unknown in countries where Caesarean sections are easily available. Other lingering problems may include anaemia, incontinence and sterility. Obstetric fistulae disproportionately affect very young and very poor women. Internationally, girls under 15 are 25 times more likely to have critical complications related to pregnancy than women in their 20s.
(f) Prevention outside the health care system: road traffic initiatives: As noted, accidents are a major cause of disability, and traffic accidents account for a significant share of all accidents. While this is increasingly acknowledged in India, efforts to address the epidemic of traffic accidents have been more limited. Recently, GoI has produced a draft National Road Safety Policy which sets a number of positive directions for action. However, execution of policy is largely a matter for the states, and concrete action has been lacking in many cases. Kerala provides a positive example of state-level action which addresses a range of factors in road safety, with a state-level Road Safety Action Plan developed, and initial implementation begun through initiatives such as a Good Practice Manual of Public Education in Road Safety. Pilots are under discussion in the Cochin/Ernakulam area for model road safety programs including promotion of seat belt and helmet use. There has also been focus on police accident reporting practices, vehicle fitness initiatives, and emergency medical response to accidents. Tamil Nadu is also taking action such as mapping of “accident black spots”, with planned investments in both improving road safety and in medical response capacity in high-risk areas.
Curative and rehabilitative health interventions and PWD
As noted in Chapter 7, the health sector is the one where the PWD Act makes the weakest incremental commitments in public policy. This is for two main reasons. Firstly, it focuses mainly on prevention and early detection of disabilities, and raising of public awareness on these issues. It does not make specific additional commitments on treatment and rehabilitation of PWD. Secondly – in contrast to areas such as education and employment – the Act’s provisions on health are in the form of unenforceable commitments due to the rider “within the limits of [governments’] economic capacity and development”. As a result, respect to health issues and PWD, the Act remains largely aspirational even in principle with, mainly outlining the type of prevention and early detection initiatives that states should seek to implement.
Both policy and practice therefore indicate that the bulk of both prevention and treatment of disability will continue to happen as part of the broader public and curative health delivery systems. Equally, access to health for PWD will be characterized by a combination of elements common to all people (e.g. the effects of household income on access to care), as well as disability-specific needs and issues of access. There is thus a complex interaction of supply and demand side factors that come into play. Figure 3.3 sets out some of the linkages.
This section explores specific elements of the health delivery system which are of particular relevance to PWD. This includes initiatives that are specific to PWD in both the public and non-governmental/community sectors (e.g. disability certification), and some where interactions of PWD with the general health delivery system may raise issues above and beyond those of the general population.
Figure 3.3: Demand and supply side linkages in health and disability
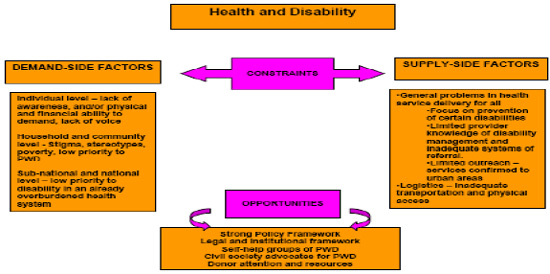
Source: Das (2006)
- Dedicated PWD health services: Generally, the focus of PWD-specific public interventions has been on rehabilitation. Technological support on rehabilitation is provided by the five National Institutes on disability, set up in the 1970s and 1980s. 24 The mix and PWD coverage of services by the Institutes is presented in Table 3.9, which have serviced just over 1.8 mln. PWD in their existence. In recent years, India is placing an increased emphasis on social and community based approach. In early 1995, the Government launched the District Rehabilitation Center (DRC) Scheme as a model of comprehensive rehabilitation services to rural PWDs. The scheme operates in 11 centers in 10 States. The objectives of the DRC include surveying the disabled population, prevention, early detection and medical intervention and surgical correction, fitting of artificial aids and appliances, therapeutic services - physiotherapy, occupational therapy and speech therapy, provision of educational services in special and integrated schools, provision of vocational training, job placement in local industries and trades, self-employment opportunities, awareness generation for the involvement of community and family to create a cadre of multi-disciplinary professionals to take care of major categories of disabled in the district.
There are 4 Regional Rehabilitation Training Centers (RRTC) that function under the DRC scheme which provide training to village level functionaries, DRC professionals, and State Government officials. They also conduct research in service delivery and low cost aids production. Apart from developing training material and manuals for field use, RRTCs also produce material for creating community awareness. A National Information Center on Disability and Rehabilitation was also established in 1987 to provide a database for comprehensive information on all facilities and welfare services for the disabled within the country. It acts as an agency for awareness creation, preparation/collection and dissemination of materials/information on disability relief and rehabilitation.
Table 3.9: Coverage of National Institutes for PWD by Type of Services
Institution Special Educators Trained Rehabilitation Services Extension Services Clinical Services Total PWD served National Institute of Hearing Handicapped 2,536 23,452 11,077 175,893 212 National Institute of Mentally Handicapped 31,804 14,445 54,071 18,923 119,243 National Institute of Orthopedically Handicapped - 23,487 65,083 221,804 310,374 National Institute of Visually Handicapped 5,972 325,771 83,463 24,128 439,514 Institute for the Physically Handicapped 619 22,090 47,201 65,652 135,562 National Institute of Rehabilitation Training and Research 415 26,369 1,863 330,437 359,089 District Rehabilitation Centre/Regional Rehabilitation Training Centers - 26,614 149,583 204,286 380,483 Total 41,346 462,228 412,526 1,041,123 1,957,223
Source: Asia Pacific Development Center on Disability India Country Profile.
State governments have their own policies and schemes for PWD as well. These include institutes that are run by state governments and grants to NGOs that access schemes of the state governments. The issue of access to health services that are not rehabilitative in nature has been addressed only obliquely. For instance, the RCI has a program for the training of medical officers in Primary Health Centers.{mospagebreak}
Perhaps the most interesting set of services being offered to PWD in India are Community Based Rehabilitation (CBR), which has been effective in rural areas in addressing the primary care and therapeutic needs of people with PWD. Surprisingly, this mode of service delivery is missing from the PWD Act. CBR has been promoted with particular strength in south India, often with initial international funding through NGOs. At the same time, CBR strategies have constantly been evolving in response to changing needs, times and criticisms. Despite this, CBR has to date been implemented in only around 100 (of around 600 total) districts, and only 6 percent of villages have coverage of rehabilitation services within 10 kilometres.
While there is no single CBR model, most CBR initiatives share a range of common objectives and features, i.e. to: (i) deinstitutionalize medical care, working with PWD in their communities; (ii) expand PWD access to rehabilitation services; (iii) demedicalize social responses to disability and thereby help reduce social stigma; and (iv) shift investments away from curative to preventive measures. The concept is institutionally flexible and can be operationalized by communities, NGOs and government, separately or in partnerships. Local level identification, training and technology development is encouraged, involving not only disabled people and their families but teachers, healers and religious leaders.
There is also significant community outreach by hospitals and community institutions for the disabled: Medical colleges, hospitals, schools of social work, and institutes of higher education often have a community outreach programs for PWD. For instance, the renowned cerebral palsy institutes started rural and slum outreach programs in the 1970s, where their staff provided community-based services to children with CP and multiple disabilities. Several of these outreach units developed into independent centers of community based rehabilitation. Vidyasagar – an institute for children with multiple disabilities in Chennai, also has an ongoing partnership with local hospitals and assessment centers to which it refers its clients. Its outreach has also included links with specialized centers for specific disabilities.
Use of Health Services by PWD
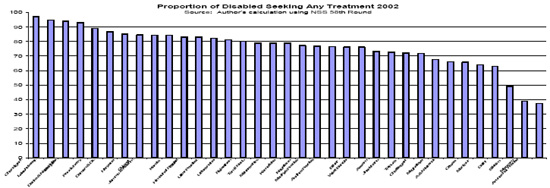
As noted, there is relatively limited research on use of health services by PWD in India, and the drivers of usage patterns. This section reports NSS data on overall use of health services by PWD and more specifically access to aids and appliances. It also includes evidence from the UP and TN village survey. Figure 3.4 outlines self-reported seeking of health treatment by PWD in the previous [year] for 2002. 25 Overall, a large proportion of PWD – almost 80 percent – sought some treatment in the previous [year]. Disaggregating by state, a few points emerge:
- overall, PWD in north-eastern states tended to have low use of health services, with Mizoram and Arunachal Pradesh less than half the national average usage among PWD.
- broadly, states that are lagging in overall supply of health services also lag with respect to use of services by PWD.
- the exception is Delhi, which has good services overall, but less than fifty percent of PWD who sought any treatment.
Figure 3.4: Proportion of disabled seeking any treatment 2002
NSS also allows examination of factors that affect the probability of PWD seeking treatment. The results are reported in Table 3.10, which reports the regression results on the probability of seeking treatment among specified categories of PWD relative to a series of reference category PWDs. 26 A number of interesting findings emerge:
- being disabled from birth has a major impact on likelihood of having sought treatment, with those disabled from birth more than 70 percent less likely than those who acquired their disability later in life to have sought treatment.
- women are around 13 percent less likely than PWD men to seek treatment.
- higher levels of PWD education substantially increase the likelihood of seeking treatment.
- PWD with locomotor conditions are the most likely to have sought treatment, while the other extreme is those with hearing and speech disabilities, who are less than half as likely as locomotor PWD to have sought treatment.
- predictably, ST/SC/OB status has a negative effect on likelihood of seeking treatment, with ST in particular only half as likely to have sought treatment. This can be considered to be picking up broader income/welfare features which are not well captured in the data.
- the north-east and eastern regions have easily the lowest likelihood of having sought treatment by PWD. The northern region in contrast has the highest likelihood of having sought treatment.
- those in urban areas are 55 percent more likely to have sought treatment, reflecting not only the generally better access to health services, but also the disproportionately worse situation with respect to disability-specific rehabilitation and treatment services offered in rural areas.
- PWD living with their parents are much more likely to have sought treatment.
- several indicators had either statistically insignificant impacts on likelihood of seeking treatment, or significant but marginal impacts. These include the age of the PWD, whether or not they are married, household size, and amount of land possessed by the household.
Table 3.10: Probability of PWD seeking health treatment, 2002
| Variable | Odds ratio of the probability of ever seeking treatment |
| Individual Characteristics | |
| Female | 0.87 |
| Age | 0.99 |
| Any education up to primary | 1.32 |
| Post Primary | 1.64 |
| Disabled from Birth | 0.28 |
| Disability Dummy (Locomotor as reference) | |
| Mental | 0.75 |
| Visual | 0.61 |
| Hearing | 0.43 |
| Speech | 0.43 |
| Household Characteristics | |
| ST | 0.53 |
| SC | 0.74 |
| OBC | 0.89 |
| Household Size | 1.02 |
| Residence | |
| Urban | 1.55 |
| North | 1.40 |
| South | 1.16 |
| East | 0.78 |
| West | 1.14 |
| NE | 0.78 |
| Living Arrangements (Living w/ Parents as reference) | |
| live_alone | 0.59 |
| live_spouse | 0.77 |
| live_kids | 0.62 |
| live_other | 0.66 |
Notes: (a) all coefficients significant at the .001 level except NS=not significant; (b) Reference categories for dummy variables are upper caste, no education, central region (UP/Uttarnachal, Bihar, Jharkhand), rural, currently not married or never married, and male. Source: Das (2006), using logistic regression.
The NSS does not provide information on what types of health services PWD accessed, nor information on why PWD did not access services. Some information is available on these questions from the UP and TN survey, from which results are presented in Table. In terms of type of service received, easily the dominant one was medication (in 86 percent of cases), with physical therapy the only other significant service (in 44 percent of cases). In terms of type of provider accessed, the results in Table 3.11 for PWD are not noticeably different from non-PWD population in terms of public/private and allopathic/traditional service providers. With respect to reasons for not accessing services, the dominant reasons are economic, and others are probably common to the non-PWD population. However, around 16 percent of PWD report negative attitudes of providers as a reason for not seeking treatment. Finally, the failure to note inaccessibility has to be interpreted with caution, as these are local facilities which may be accessible by default (e.g. entire facility at ground level; no facilities like toilets).
Table 3.11: Type of Service Accessed and Reasons for Not Using Services by PWD, UP and TN
| Type of facility used if healthcare facility accessed in the last 3 months (multiple responses possible) |
|
| Public health facility – Allopathic | 31.6% |
| Private health facility – Allopathic | 61.4% |
| Private health facility – Traditional | 17.5% |
| Faith healer, tantric, or astrologer or other facility | 7.1% |
| Reasons for not using health facilities even if needed (multiple responses possible) |
|
| No services in area | 52.3% |
| Transportation | 20.5% |
| Could not afford services | 70.5% |
| Building inaccessible | 0.0% |
| Waiting time too long | 13.6% |
| Providers don’t treat people like me | 15.9% |
| Other | 2.3% |
Source: UP and TN village survey, 2005.
Clearly more work is needed on both the health-seeking behaviour of PWD and the extent to which their problems in accessing decent services are similar to those of the general population, or have specific features above and beyond that such as attitudinal or physical access problems. One specific service that is important for many PWD is access to aids, appliances and assistive devices. Evidence on this is presented in Table 3.12. Only just over 20 percent of PWD in the NSS 58th Round had ever been advised on aids and appliances and less than 16 percent had acquired any such aids or appliances. Of those who had acquired them, less than one fifth nationally had got them through a government scheme, with almost two thirds purchasing themselves. This is shown in Figure 3.5, which also shows the cross-state variation in Government assistance, with some states such as Chattisgarh having well over 40 percent of aids and appliances provided by Government, while in much richer states such as Gujarat that share was only around 10 percent. The generally low awareness of government schemes for free aids and appliances that the numbers suggest is supported by results from the TN and UP survey, which found that close to half of PWD respondents were not aware of such schemes (and that only 4 percent of all PWD had benefited from them).
Table 3.12: Disabled Individuals’ Access to Aids and Appliances
| Percent | |
| Acquired | 15.95 |
| Not acquired | 6.0 |
| Not advised | 78.0 |
Source: Das (2006), using NSS 58th round
Access to free aids and appliances is currently within the ambit of a social security system that functions very inadequately, not in small part due the manner in which it is designed. Thus, assistance to buy aids and appliances fall within a range of individual beneficiary schemes that often have serious implementation problems and low coverage. Due to this and other demand and supply side issues, coverage of rehabilitative services and aids is very limited. In addition, systems for support and maintenance of assistive devices remain under-developed.
Source: Das (2006), using NSS 58th round.
Table 3.13 also presents results on probabilities of accessing aids and appliances according to various characteristics. While many of the results are similar to probabilities of seeking treatment, there are a few interesting differences:
- female PWD are even less likely relative to male PWD to receive aids and appliances than they are to seek treatment (this may also be a factor of the low number of women technicians)
- while those disabled from birth still have lower rates of access (around two thirds the level of other PWD), the situation is considerably better than for seeking treatment relative to PWD who acquired their disabilities later in life.
- the disability-specific probabilities are quite different to those for seeking treatment, with visually impaired people substantially more likely to receive aids and appliances, and those with speech impairments having insignificant probability.
Table 3.13: Results on Probabilities of Accessing Aids and Appliances
| Variable | Odds ratio of the probability of acquiring aids and appliances |
| Individual Characteristics | |
| Female | 0.71 |
| Age | 1.02 |
| Any education up to primary | 1.23 |
| Post Primary | 1.56 |
| Currently Married | 1.06NS |
| Disabled from Birth | 0.64 |
| Disability Type (Locomotor as reference) | |
| Mental | |
| Visual | 1.56 |
| Hearing | 0.55 |
| Speech | 0.04 |
| Household Characteristics | |
| ST | 0.63 |
| SC | 0.81 |
| OBC | 0.87 |
| Household Size | 0.99 |
| Residence | |
| Urban | 1.46 |
| North | 1.40 |
| South | 1.10 |
| East | 0.95NS |
| West | 1.36 |
| NE | 1.38 |
| Living Arrangements (Living w/ Parents as reference) | |
| live_alone | 0.72 |
| live_spouse | 0.69 |
| live_kids | 0.63 |
| live_other | 0.74 |
Notes: (a) all coefficients significant at .001 level except NS=not significant; (b) upper caste, no education, central region (UP/Uttaranchal, Bihar, Jharkhand), rural, currently not married or never married, male are reference categories for dummy variables. Source: Das (2006), using NSS 58th round logistic regression.
Factors affecting PWD access to health care
This section outlines some of the more specific challenges faced by PWD in accessing decent health services, some on the supply side of the system and others on the demand side.
- Disability identification and certification: A critical element of accessing treatment and rehabilitation services for PWD is identification and certification of disability. The challenges in institutional coordination of disability identification are discussed in Chapter 4. With respect to certification, the standard model is to rely on assessment and certification by teams at district hospitals. The obvious shortcoming of the system is that rural populations will often have low knowledge of and access to such teams (in addition to the costs associated with accessing district headquarters). In addition, evidence from Orissa indicates that arrangements for disability certification do not always function well, with only just over 10 percent of hospitals having disability certification schedules in place. 29 This is supported by research from Rajasthan which found vacancies for essential medical posts at districts facilities led to major problems with certification. 30 Faced with such challenges, disability NGOs have in some areas assumed a more assertive role vis-à-vis their district hospitals, e.g. in Rajasthan, the disability group Viklang Sangharsh Samiti attends the district hospital every week on the day designated for certification and monitors doctors’ attendance and completion of certification of all PWD who present.
To address the problems with district level certification, the authorities have also relied on a camp-based approach to disability identification and certification. This is a more accessible form, but still faces major challenges in both scale of outreach and human resource capacity to go to scale. The shortcomings of the current identification and certification process are brought out by results from the UP and TN survey, which found that 56 percent of PWD were not aware of the disability certification process, and that only around 21 percent were in possession of a PWD card.
There is clearly a major challenge in developing mixed models of early identification of disabilities which are feasible in the face of supply side constraints on qualified assessors. In this regard, many potential actors will be involved, from health care providers to anganwadis to the new asha workers under the National Rural Health Mission to schools and communities themselves. A key need will be simple tools which allow for screening and referral of at-risk infants and children. Pilot exercises underway in a number of developing countries provide a model which is worthy of more systematic use in India, and has already been effective on a localized basis in India through initiatives such as Samadhan’s community worker model of early screening in poor areas of Delhi. The Ten Question Screening Instrument developed by WHO based on extensive developing country pilots is outlined in Box 3.1. - Attitudes and knowledge of health service providers: As with education, provider attitudes to PWD can have significant impacts on their access to health services. This is an area that to date has received less attention than attitudes among education professionals. However, the limited available evidence indicates that provider attitudes seem to be a constraint on PWD access to health services. Research from hospitals throughout Orissa found that less than 40 percent of providers were aware of entitlements under the PWD Act, and that close to 40 percent of them considered PWD as a burden. In Gujarat, many village health workers did not know that mental illness and retardation were disabilities. The existence of attitudinal barriers receives support from the UP and TN survey also, which found that 16 percent of PWD did not seek health services due to provider attitudes. In addition, field research from Karnataka and Rajasthan indicates a generally low level medical awareness among health care providers of disability issues, in particular with respect to mental health. Finally, articulation of demand by district and sub-national governments for health services for PWD is poor. This is partly due to the fact that - in a system that is struggling to respond to overall health issues - disability has little priority, and partly because disability is subsumed within the preventive programs.
Box 3.1: WHO’s “Ten Question Plus” Screening Instrument
WHO has over the past 25 years been developing a simple methodology for identification of children at risk of disability, and subsequent screening. It relies on the two-phase Ten Question Screening Instrument (TQSI), recently adjusted to include an eleventh question in the so-called TQSI plus. The first stage is carried out by community workers, and seeks to identify children whose mothers answer positively to one of the eleven questions below. A short questionnaire in the Yes/No format was developed to identify 3-9 year old children with disabilities in community-based setting. Of the ten questions, four were concerned with child’s vision, hearing, movement and seizures, and six concerning the child’s cognitive competence.
House to house survey on approximately 1000 children was carried out by community workers. It was followed by professional assessment of children who were screened positive. A small proportion of randomly selected presumed non-disabled children (screened negative) was also assessed. The original instrument was modified to test whether the instrument could be used on children as young as 2 years of age. For this purpose an alternative version of question 9 on speech was used on children younger than 3 years old. TQ has been validated to be used for screening disabilities in 2-9 year old children.- Compared with other children, did the child have any serious delay in sitting, standing or walking?
- Compared with other children does child have difficulty seeing, either in daytime or at night?
- Does the child appear to have difficulty hearing?
- When you tell the child to do something, does he/she seem to understand what you are saying?
- Does the child have difficulty in walking or moving his/her arms or does he/she have weakness
and/or stiffness in the arms or legs? - Does the child sometimes have fits, become rigid, or lose consciousness?
- Does the child learn to do things like other children his/her age?
- Does the child speak at all (can he/she make himself/herself understood in words; can he/she say any recognisable words?
- For 3- to 9-year-olds ask:
Is the child's speech in any way different from normal (not clear enough to be understood by people other than his/her immediate family?
For 2-year-olds ask:
Can he/she name at least one object (for example, an animal, a toy, a cup, a spoon)? - Compared with other children of his/her age, does the child appear in any way mentally backward, dull or slow?
- Compared with other children of his/her age, does the child appear in any way mentally backward, dull or slow?
To validate the TQSI, an international pilot study of severe childhood disabilities was conducted in 9 developing countries (Bangladesh, Brazil, India, Malaysia, Nepal, Pakistan, Philippines, Sri Lanka and Zambia) in 1980-1981 by WHO and partners. It has proven to be a non gender biased screening instrument that identifies high risk groups and is sensitive for sensory, cognitive, motor, and seizure disabilities. It has proven to be a reliable, efficient and low-cost instrument for undertaking surveillance and monitoring the prevalence of developmental disabilities where professional resources and technology are limited.
TQ probe is a modified version of the Ten Questions used in the original pilot study. As before, it is a short questionnaire, in a Yes/No format consisting of 11 questions with probes concerning the child’s vision, hearing, movement, and seizure, and six concerning cognitive competence, and one extra question regarding any other serious health problems. Each question was supplemented with additional one or more questions to further probe into the problem detected. The probe questions were only asked if a problem was reported in response to the main question. For each 2-9 year old child listed and still living in a household, one TQ probe was completed. The two stage methodology is now being piloted in seven countries across four regions in the OECD/World Bank Disability Screening Initiative.- Vietnam and Indonesia in East Asia
- Bangladesh in South Asia
- Ethiopia and Kenya in Africa
- Panama and Mexico in Latin America and Caribbean
Source: OECD and World Bank staff - Physical access to health facilities: Again, this remains an under-researched area, though there is an increasing number of NGO access audits on facilities which confirm significant issues in physical access for PWD. The courts have also been active in certain cases in promoting access of PWD to basic services. 34 As noted, problems of immediate physical access to PHCs were not identified by PWD in the UP and TN survey as an issue. However, around on fifth of respondents identified accessible transport as a major issue, indicating that “door to door” access remains an issue for health services. In addition, results from other states indicate that physical access is indeed a significant problem at higher levels of the system. In addition, evidence from Orissa for example suggests that more complex facilities like district hospitals have serious access issues for PWD, with for example the main entrance in around half the hospitals and toilets in around 90 percent of hospitals not being accessible.
- The number of rehabilitation staff available is inadequate. According to WHO’s guidelines at least one trained P and O (prosthetics and orthotic) personnel is required to meet the needs of 1000 people in need. In India, there are estimated to be less than 700 in total, against a need of over 10, 000. The number of P and O facilities is also low. In India there are approximately 500 workshops, and 80 percent of these services are located in the major cities.
- A poor referral system which doesn’t fully utilize the expertise at the higher levels of the system. At present there are a collection of disparate services between health and rehabilitation and there is a need to develop a supply chain from PHCs with community participation to national level medical and rehabilitation services. There are however, promising initiatives such as that in 9 districts of Gujarat, which aims to: (i) enhance knowledge and skills of primary health professionals in disability identification and prevention so that they are able to identify persons with disabilities and persons at risk of developing a disability and refer them for intervention; and (ii) improve coordination between government health providers at different levels through developing mechanisms for referral, treatment and follow-up ensuring improved access and continuity of service.
- Financial barriers to access: As for the general population, the bulk of health services for PWD in India are provided by the private sector, both qualified and unqualified. As such, to the extent that PWD households are poorer than average (as evidence in Chapter * indicates is the case), financial barriers to access will be higher than average. In addition, it could be assumed that PWD may have higher than average need for health services due to their disabilities, and hence potentially incur higher expenditures and financial constraints. This is an area where limited evidence is available. The UP and TN survey results are, however, consistent with such a hypothesis, with per capita spending on health care by PWD households around 26 percent higher than that of non-PWD households. The household level spending trade-offs this necessitates can be seen in the lower average spending on education and lower average savings rates of PWD relative to non-PWD households in the same survey.
- Weakness in mental health policy and services: Mental health is an area that continues to suffer particular neglect in both policy and implementation. The National Mental Health policy was originally articulated in 1982. The fulcrum of the policy was the District Mental Health program (DMHP), which barely reached 25 districts in the country. The government recognizes the gaps in access to mental health and its growing role in the community. The policy is in the process of being re-envisioned with an emphasis on institutional reorientation, improved community awareness, strengthening of community mental health initiatives, improved research and informational resources, and improved priority setting and inter-sectoral collaboration.
- Community attitudes: As in many areas of disability, community attitudes continue to be a constraint on raising the profile of health services for PWD. This is particularly the case with mental illness, but also a more general product of community attitudes to causes of disability which place insufficient emphasis on health-related causes of disability. Such attitudes are in part driven by the lack of voice of PWD, which may limit their capacity to articulate their need for health services. For some PWD, communication may itself be an issue, and so they may be additionally constrained by the nature of their disability. In sum, the status of the PWD within the household, age, type of disability, and time of its onset, can all affect the demand at the individual level.
Conclusions and Recommendations
It is clear that much remains to be done to improve the response of health systems to disability, both in terms of prevention and in terms of access to treatment and rehabilitation services. While specific interventions and services for prevention and treatment of disability are needed, improvements in the general public health and health delivery systems will have the most significant benefits in the area of disability: The analysis points to one overwhelming conclusion: the major share of disability is caused by poor access to health services, malnutrition and diseases that are peculiar to developing countries. Thus, prevention of disability is intrinsically related to reform of the public health system. It is also clear that prevention of disability is also dependent on policies and actions outside the health system, including in the areas of road and workplace safety, water and sanitation, and nutritional interventions.
Improvements in access to care and outcomes for PWD are needed in several areas, some of which are in the general public health and health delivery systems and other specific to services for disabled people:
Improving identification and certification of disability: A thorough review of the existing early identification system for disability, with strong coordination between the ICDS system and local health care providers (both public and private), is needed to improve early identification of disability and ensure more cost effective prevention and treatment. The TQSI probe methodology seems worth experimenting with in this respect. This effort needs to be accompanied by improved outreach and possibly simpler procedures for disability certification, including raising awareness that such a system exists. Given the serious supply side constraints, it also seems sensible to explore accreditation of qualified private health care practitioners for disability certification. While this is not without risks and would require a basic oversight mechanism, it seems a feasible way to address the major outreach problems of the public sector with respect to certification.
Minimizing the incidence and severity of disability: Cost effective interventions to minimize disability need to be strengthened, including iodization of salt (recently made mandatory once more), and micronutrient supplementation for children and pregnant women. This would include a reversal of declining immunization coverage (polio excepted), which is contributes to both disability and mortality rates. Current efforts such as provision of simple aids such as glasses or crutches also need to be expanded – in partnership with the private sector – to prevent mild impairments becoming serious disabilities which compromise learning, work, and other activities of daily life. The importance of simple interventions such as cataract surgery and hearing devices will also increase with an ageing population. However, other efforts will be needed beyond the health sector. Efforts to promote road safety are an important case, with the rapid expansion in accident-related disability. While the draft National Road Safety Policy is one step, greater efforts at the state level such as those being pioneered in Kerala and Tamil Nadu are needed to stem the major increase in traffic injuries and death.
Improving quality of care for disabled people: Key actions to be taken include (i) better integrating disability management in existing health delivery systems. Departments of social welfare, health and W and CD have to work together and in tandem with early intervention through the education system, NGOs and communities. This would include joint disability training for local level service providers and communities based on common mandates, combined with incentives and identification of influential champions. Improving training of PWD as health advocates and field facilitators is needed if they are to become active agents and not passive beneficiaries are also important; (ii) improved referral systems for the existing rehabilitation network, followed by increased funding and personnel (whose levels are currently at less than 10 percent of WHO standards for developing country rehabilitation services); (iii) a stronger distribution network for Government programs of aids and appliances, including awareness raising of among PWD and incentives schemes for producers; (iv) improved centers and resources devoted to disability management, including assessment, rehabilitative services and medical intervention Indian organizations have capacity to develop low cost technology for PWD, but need adequate funding and incentives, and finally, (iv) more aggressive efforts to develop government and NGO partnerships in all areas of disability services will be needed to strengthen service delivery; and finally (v) continued efforts to ensure that prevention of disabilities through immunization and other preventive measures is strengthened.
Addressing current and future provision and information gaps. New legislation and its enforcement are needed, particularly in the areas of mental health and road safety (including emergency care), both of which are increasingly important causes of disability. The aging of the population and attendant disability needs of the elderly will need to be addressed. Finally, data and statistics on disability need to be more reliably and regularly collected, in particular through strengthened NFHS and general health surveys, which have neglected disability. More specifically, India has some way to go in developing a robust injury surveillance system, including for road accidents, and examples such as Thailand’s National Injury Surveillance System introduced in 2003 provide useful lessons in this respect.
Given capacity constraints, improving the health sector’s response to disability may most feasibly happen in two phases. The first phase would concentrate on accelerated response closest to the community. This would include an improved certification system, promotion of CBR (including awareness raising and stigma reduction), and enhancing micronutrient supplementation (including food fortification) and immunization. The supply side interventions would need to include training of general duty medical officers in disability certification, and of community volunteers. The second phase would focus on improved referral systems between levels of the health system, including increased supply of therapists and support for establishment of therapy centers in rural areas. It would also likely involve networking of hospitals and specialized centres, possibly with support from the private corporate sector.