Employment is a critical element of independent living, and previous research has found that it is a primary aspiration of people with disabilities in India. 1 Earlier chapters have shown that the large majority of PWD in India are capable of productive work, in the bulk of cases without the need for aids or appliances. This chapter explores trends in employment status of PWD in India up to the early 2000s, as well as public and non-governmental interventions to improve employment opportunities for PWD.
Labor Market status of PWD
(i) Employment rates: In all countries, the employment rates of PWD are lower than for the non-PWD population. This is true even in high income countries with the most progressive employment practices and strong active labor market programs. This can be seen in Figure 5.1. India’s ratio of PWD to non-PWD employment rates is around average for the group shown, though one would expect the negative welfare consequences of lower employment rates for PWD in India to be greater due to the much weaker social security system. The country-specific ratio does not appear to be linked simply to income levels, with Japan with a 38 percent ratio and Norway with 76 percent both being very high income.
Internationally, PWD employment rates are significantly below the rest of the population
Figure 5.1: Employment rates of PWD and non-PWD, various countries
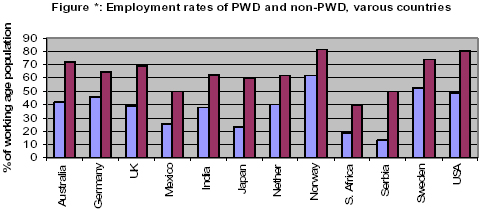
Sources: OECD (2003); Mitra and Sambamoorthi (2005). Japan – physical disabilities only. India and Serbia – non-PWD column general population.
While international comparison is of interest, the more important comparisons are across groups and over time within India itself. Figures 5.2 and 5.3 summarize information from NSS sources for the early 1990s and the early 2000s for both urban/rural and by gender. Some points of interest include:
- PWDs have lower employment rates than the general population across all main locational and gender cuts.
- the PWD employment rate actually fell from 42.7 percent in 1991 down to 37.6 percent in 2002. The five percentage point difference results in part from the different sample, as persons with mental illness or retardation were not counted as PWD in the 47th round, and were in the 58th round, where they were the PWD sub-groups with the lowest employment rates. However, the finding on a reduced PWD employment rate between the early 1990s and early 2000s holds even when MI and MR people are omitted from the 58th round sample. Excluding MI and MR, the employment rate of PWD still stands at 39.6 in 2002, i.e. 3.1 percentage points lower than in 1991 (and statistically significant). 2 This compares to a fall of only 1.1 percentage points for the general population (from 58.6 to 57.5 percent) between 1993 and 2000. Further research is needed to understand the determinants of the decline in the employment rate of persons with physical and sensory disabilities between 1991 and 2002, in particular to assess if it results from changes in the demographic composition of the population with disabilities, in the increased severity of disability, or factors in the labor market and society.
- While trend comparisons are not possible, the low absolute employment rate among persons with disabilities is broadly support by results from the 2001 census.
Employment rates of PWD in India are lower than the general population for both genders and across urban and rural areas, and have fallen in the 1990s
Figure 5.2: Employment rates of PWD and general population by gender and location, early 1990s
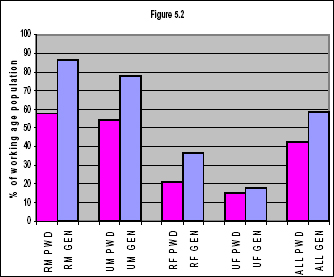
Figure 5.3: Employment rates of PWD and general population by gender and location, early 2000s
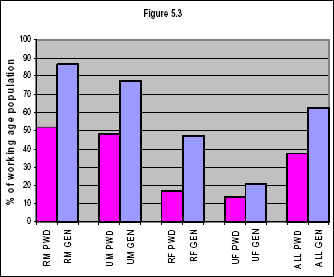
Source: Mitra and Sambamoorthi, based on NSS 58th and 47th rounds in 2002 and 1991 (PWD) and 55th and 50th rounds in 1993/94 and 1999/00 (non-PWD).{mospagebreak}
In a country as diverse as India, it is interesting to explore statewise aspects of PWD employment. Given the variations in state-level employment rates for all groups, an informative way to do this is comparing the state-specific ratio of the PWD employment rate with that of the non-PWD working age population. This is presented in Figure 5.4. Points of note include:
- the fall in the employment rates of PWD relative to the general working age population during the 1990s is almost universal across the country, with the exception of Sikkim.
- however, the extent of the relative decline varies greatly, with states such as Gujarat, Rajasthan and Maharashtra exhibiting small falls in the PWD/non-PWD employment ratios, while others such as Jammu and Kashmir, Bihar and Assam have seen large falls in the relative employment position of PWD.
The relative employment rates of PWD and the general population vary significantly by state, but have fallen since the early 1990s in nearly all states
Figure 5.4: PWD and non-PWD employment ratio, early 1980s and 2000s
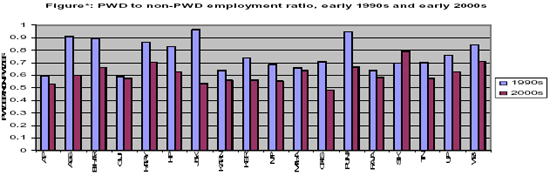
Source: Mitra and Sambamoorthi, based on NSS 58th and 47th rounds in 2002 and 1991
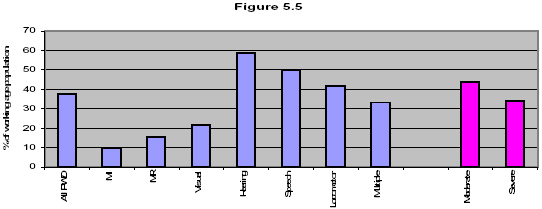
It is also useful to explore the employment rates of people with disabilities by major categories of disability captured by the NSS. These are presented in Figure 5.5 for 2002. All categories of PWD have employment rates below the general population average. However, employment rates vary sharply by type of disability, with those with mental illness, mental retardation and visual disabilities having very low employment rates at one extreme and those with hearing disabilities with employment rates around 94 percent of the rate of the general working age population, and those with speech and locomotor disabilities having employment rates above those of the average for disabled people. In addition, those with more severe disabilities have an employment rate around 22 percent (about 10 percentage points) below those with moderate disabilities, or around 45 percent below the rate of the general population.
Employment rates vary sharply by type of disability but less between moderate and severely disabled people
Figure 5.5: Employment rates by disability type and severity, 2002
A further important aspect of employment rates is variations between PWD and the general population by level of education. This is shown in Figures 5.6. and 5.7 for the early 1990s and early 2000s. Two points of interest are:
- the gap in employment rates between PWD and the general population is more pronounced for those with the lowest levels of education in both periods.
- the gap between PWD and general population employment rates has widened for all education levels between the early 1990s and early 2000s. In the early 1990s, PWD with secondary education and above had very similar employment rates to the general population with the same level of education. By the early 2000s, the gap even at these educational levels had widened, though remained lower than for those with lower levels of educational attainment. For those with low levels of education, the already large gap between PWD and the general population widened sharply in the 1990s. For the illiterate PWD population, their employment rate was 64 percent that of the general illiterate population in the early 1990s but fell to 47 percent by the early 2000s. Not only have PWDs lost out in employment terms in the 1990s, but those likely to be poorest (i.e. with the lowest educational attainment) have lost out proportionally more.
PWD employment rates are lower than the general population at all educational levels, and the gap has widened over the 1990s
Figure 5.6: Early 1990s
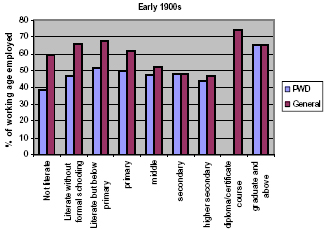
Figure 5.7: Early 2000s
Source: Mitra and Sambamoorthi
{mospagebreak}
An interesting dimension of employment rates is the life cycle effects, i.e. how employment rates for PWD and non-PWD evolve as people age. This is presented in Figure 5.8. The lower average employment rates of PWD are sustained across the life cycle. Overall, both PWD and non-PWD exhibit a predictable trajectory of rising employment rates till early middle age and declining rates thereafter, with urban male employment rate trailing off more quickly. However, there are differences between urban and rural patterns. The two points of note are: (i) that rural PWD males and females start with much lower employment rates in the 15-19 age group and basically never catch up. This is not entirely predictable, given that PWD young adults are less likely to be in education; and (ii) in contrast, the starting rates for PWD in urban areas are closer to those of non-PWD (for women, the same). For urban PWD men, the ground is lost early - between entry and the 25-29 bracket - after which they never catch up to non-PWD. For urban women, the (much lower) differences to non-PWD urban women emerge in their late 30s.
Figure 5.8: Employment rates over the life cycle for PWD (LHS) and for non-PWD (RHS)
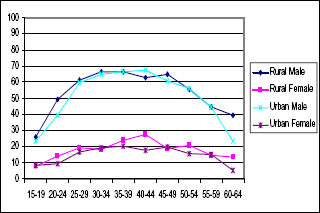
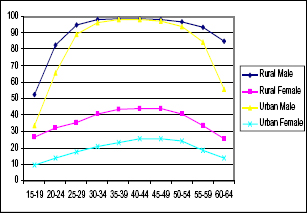
Source: Mitra and Sambamoorthi, using 58th round NSS for PWD and 55th round for non-PWD.
(ii) Sectoral Composition of PWD Employment: Overall, the sectoral composition of employment among PWD is not substantially different from the general population (Table 5.1). The differences of note are: (i) the higher share of PWD workers in agriculture-related activities (i.e. the fall in share in agriculture-related has been less sharp than for non-PWD over the 1990s); and (ii) the higher share of PWD in wholesale/retail trade and hotels/restaurants (hospitality in table). Also of note (not shown) is that disabled people had around a 10 percent higher rate of self-employment than the general population.
Table 5.1: Sectoral composition of PWD and general employment, early 1990s and early 2000s
| Early 2000s | Early 1999s | |||
| PWD | General | PWD | General | |
| Agriculture Related | 54.9 | 59.2 | 49.8 | 61.7 |
| Manufacturing + mining | 12.8 | 11.4 | 11.7 | 11.6 |
| Utilities | 0.3 | 0.3 | 0.9 | 3.6 |
| Construction (F) | 4.2 | 4.8 | 2.5 | 3.6 |
| Trade/Hospitality | 14.1 | 10.4 | 10.3 | 8.0 |
| Transport, storage and communications (I) | 3.5 | 3.9 | 2.7 | 3.3 |
| Financial /RE / Business / Industry | 1.2 | 1.3 | 1.5 | 1.1 |
| Community / Social / Personal Services | 8.0 | 8.3 | 13.9 | 10.3 |
| Other | 1.0 | 0.4 | 6.7 | 3.1 |
Source: Mitra and Sambamoorthi, based on NSS 58th, 55th, 47th and 50th rounds.
The above sectoral disaggregation is useful, but does not reveal much on the more specific characteristics of employment type and status. Insights into these issues for the rural population are possible from the 30 village survey in UP and TN commissioned for this report. These are presented in Table 5.2, which gives the current activity status of working age males and females across disability status. Some interesting observations emerge:
- men with disabilities are less likely to be in wage/salaried employment, while the opposite is true for females.
- men and women with disabilities are less likely to be attending educational institutions compared to men and women without disabilities.
- for men and women, the share who report not be able to work due to their disability is substantial – over a third of working age PWD men (and almost half of the severe PWD men), and around one quarter of PWD women (and over a third of severe PWD women).
- nonetheless, men with disabilities are more likely to report being unable to work owing to disability than women: instead of reporting an inability to work as their current activity status, women tend to attend domestic duties.
Table 5.2: Current Activity Status among Working Age Persons, rural UP and TN
| Male | Female | |||||
| Non-PWD | PWD | Severe PWD | Non-PWD | PWD | Severe PWD | |
| Employed | 74.1% | 53.4% | 41.2% | 19.3% | 16.6% | 15.6% |
| Works on own farm | 22.2% | 22.0% | 13.5% | 4.2% | 4.1% | 3.1% |
| Self employed (home-based work) | 3.4% | 3.5% | 4.5% | 0.3% | 1.2% | 1.7% |
| Self employed (work place outside home) | 8.1% | 8.6% | 8.7% | 0.9% | 0.2% | 0.0% |
| Regular wage / salaried employee | 18.8% | 9.0% | 7.1% | 3.7% | 5.5% | 5.9% |
| Casual agricultural labourer | 10.8% | 5.9% | 5.0% | 9.0% | 3.9% | 3.1% |
| Casual labour (non-agricultural) | 10.7% | 4.2% | 2.4% | 1.3% | 1.7% | 1.7% |
| Does not work due to sickness though have regular work (of any kind) | 0.05% | 0.2% | 0.0% | 0.0% | 0.0% | 0.0% |
| Does not work due to other reasons though have regular work (any kind) | 0.05% | 0.0% | 0.0% | 0.0% | 0.0% | 0.0% |
| Unemployed | 9.0% | 2.6% | 3.2% | 2.2% | 0.2% | 0.4% |
| Not in Labor Force | 16.8% | 44.0% | 55.7% | 78.5% | 83.1% | 84.1% |
| Attending educational Institutions | 13.0% | 4.0% | 4.2% | 7.7% | 1.9% | 1.7% |
| Attending domestic duties | 2.9% | 0.6% | 0.8% | 68.8% | 50.1% | 42.2% |
| Not able to work owing to disability | 0.3% | 33.9% | 46.7% | 0.7% | 24.8% | 35.0% |
| Retired | 0.6% | 5.0% | 3.2% | 1.3% | 5.8% | 4.5% |
| Others | 0.05% | 0.6% | 0.8% | 0.2% | 0.5% | 0.7% |
Source: Mitra and Sambamoorthi (2006).
(iii) Relative Wages and Work Intensity of PWD: An important element of PWD employment is of course wages. This can not be estimated from NSS. However, the UP and TN survey allows for estimates for rural areas from those states. The results are presented in Table 5.3 for each state separately and by gender. The results are more complex than might be expected. Points of note include:
- as would be expected, the employment rate of PWD men and women compared to non-PWD is low, and lower again for those with more severe disabilities.
- there is a notable gender difference in the employment situation of PWD men and women relative to non-PWD population. The employment rate of PWD women relative to non-PWD women is significantly higher than for PWD men relative to non-PWD men, in the case of TN over 20 percent higher. A possible explanation is that the gender factor with respect to women’s employment is an important additional effect on employment rates, which dilutes the independent effect of disability among women on their employment rates.
- the relative wages of PWD to non-PWD workers shows substantial variation between the two states. The relative wages of PWD in UP are significantly lower for both men and women, while in TN they are over 10 percent higher. Across both states, the variation in wages across the year is greater for PWD men than for non-PWD but not so for women.
Table 5.3: Employment and wage rates of PWD relative to non-PWD by location, gender and severity, UP and TN, 2005
| Group | Employment ratio / non-PWD | Wage rate / non-PWD |
| UP PWD males | 0.79 | 0.89 |
| UP severe PWD males | 0.59 | 0.79 |
| TN PWD males | 0.69 | 1.11 |
| TN severe PWD males | 0.53 | 1.12 |
| UP PWD females | 0.87 | 0.78 |
| UP severe PWD females | 0.82 | 0.77 |
| TN PWD females | 0.85 | 1.14 |
| TN severe PWD females | 0.74 | 1.11 |
Source: 30 Village survey, 2005.
An interesting additional dimension captured by the above survey is intensity of work among non-PWD, PWD and severely disabled people. When it comes to usual work hours per day and work days per month, there is relatively limited difference between workers with disabilities and those without. (Table 5.4) The hours of work of PWD men and women are somewhat lower than those of non-PWD workers, but only by about half an hour per day. Even this small difference is largely offset for PWD women by slightly more work days per month than non-PWD workers. These findings go against the commonly held view that disability places constraints on the quantity of work a person can do. Once PWD are working, they are working about the same amount as non-disabled people.
Table 5.4: The Working Age Employed: Work Hours and Days in rural TN and UP, 2005
| Male | Female | |||||
| Non-PWD | PWD | Severe PWD | Non-PWD | PWD | Severe PWD | |
| Usual Work Hours per Day | 7.9 | 7.5 | 7.3 | 7.5 | 6.9 | 7.1 |
| Usual Days of Work per Month | 23.6 | 23.8 | 23.7 | 20.4 | 21.5 | 21.7 |
| Variation in Days Worked across the year | 35.8% | 42.3% | 35.3% | 23.3% | 21.7% | 22.2% |
Source: 30 village Survey, 2005
(iv) Impact on Employment of other Household Members: The above analysis looks at the labor market impacts of disability for disabled people themselves. It is also important to consider whether there are additional impacts on the employment rates and/or intensity of other household members of PWD. In principle, such effects could work in two directions. One would be if the care needs of the disabled household member require reduced work participation from other household members. However, it could also be that non-disabled household members are required to work more to offset the lower employment rates of PWD in the household. This issue has received very little analysis in the Indian literature, though the one available analysis which addresses the issue suggests that there may be significant negative impacts on the employment of other household members. 5 The following paragraphs explore two elements of work impacts on other household members using the UP and TN data: (i) the impact on whether or not adult men and women work at all in households with disabled members; and (ii) the impact on how much work they do for those who are working.
Multivariate analysis found that the impacts of having a disabled member on employment participation exhibits a significant gender difference, with other males 21 percent more likely to be working, and virtually no impact on the employment of adult women. The gender difference can be probably explained by the nature of women’s work. In aggregate, the income effect therefore appears to dominate in terms of the impact of disability on the employment of other household adults.
The survey also explored the impact on both non-PWD household member labor due to caring requirements of the PWD household member, and on the school participation of children (the latter discussed in Chapter 5). Table 5.5 below indicates the share of households where an adult at times stayed home from work to care for the PWD, and how often this occurred. It is clear that the impact on the amount of work of other adults in the household is significant. Around 45 percent of households with a PWD report an adult missing work sometimes to care for their family member. Among those, 83 percent missed some work every day to care for their household member. The average hours of work missed for carers on days where they missed work for caring was 2.5, or close to one third of the average working day. These are clearly major impacts on the household economy of a large share of households with PWD members.
Table 5.5: Missed work by adult HH members of PWD due to caring, UP and TN, 2005
| Frequency of some missed work for caring | Share of households reporting |
| Any adult missing some work | 44.7% |
| Of which: | |
| Every day | 83.3% |
| About one day a week | 2.9% |
| At least one day a month | 4.2% |
| Less often than one day a month and other | 5.8% |
| Average hours of work missed for caring on days where some work missed | 2.5 hours |
Source: 30 Village survey, 2005
The survey also explored who in the household provided such care. Overwhelmingly, it is provided by parents or spouse, in 57 percent of cases a parent and in 21 percent of cases a spouse. Also of note is that less than 1 percent of households with a PWD member had caring performed by someone from outside the household.
The aggregate effect of having a disabled household member on the employment of other adults is therefore complex. Overall, other adults are more likely to be in the workforce. However, they are also found to do less work in a day due to the requirements of caring for their disabled family member.
Determinants of employment for PWD
The above analyses are based on descriptive statistics from NSS and other sources. Their shortcoming is that the employment outcomes of PWD reported conflate the employment impacts of disabilities themselves with other characteristics of PWD, e.g. if PWD are on average older than the general working age population, their lower employment rate may reflect a combination of age and disability status. Multivariate analysis of the NSS data provides more precise insights into the determinants of employment among PWD. Potential determinants include demographic characteristics (gender, age, marital status), rural/urban, disability characteristics (type of disability, severity of disability, disability at birth), human capital characteristics (education, vocational training, work experience).
Table 5.6 presents results of a probit model of employment among PWD using the 58th round of the NSS. The results confirm some of the earlier findings. The following characteristics are associated with higher probabilities of employment among the PWD sample:
- living in rural areas, where the likelihood of PWD being employed is over 20 percent higher than in urban areas and highly significant statistically. This is consistent with anecdotal evidence of greater accommodation of PWD in rural work settings and possible income effects.
- being a male
- having a disability since birth, with the effect more pronounced in rural areas
- having a hearing, speech, or locomotor disability. The positive sign of the coefficient of the multiple disability dummy in the rural subsamples is surprising.
- being married has a relatively strong positive effect on the probability of being employed for males, but a negative effect for women.
- increased age is positively associated with the probability of employment. There is a quadratic effect in age in both male and female subsamples, with the probability of employment growing at a decreasing rate.
- having a postgraduate education (with the positive effect much stronger for women) and having vocational training.
In contrast to the above positive impacts among PWD, there are several variables which are associated with a lower probability of being employed. These include:
- having a mental illness has a strong (and statistically highly significant) negative impact on the probability of employment. For those with mental illness, the effect is much stronger in urban than rural areas, which is consistent with findings from NIMHANS that mental illness may be more stigmatizing in urban than rural settings (perhaps in part due to the nature of work, but also perhaps related to the additional stigma attaching to diagnosis).
- having mental retardation has an even stronger negative impact on the probability of being employed, and is also highly significant statistically.
Surprisingly, across all sub-samples, the educational level dummies have coefficients that are close to zero, with the exception of having a postgraduate education. Thus, overall it appears that work experience rather than education increases the probability of being employed for PWD.
For a number of characteristics, there is clear heterogeneity in the impact of certain characteristics between men and women and between rural and urban areas. Some characteristics (e.g. the strength of the impact of a hearing disability on employment) show weaker impacts for both men and women in urban than rural areas. Others (e.g. like the impact of being married and the impact of vocational training) show clearer gender rather than locational differences. One example is the impact of postgraduate education among different PWD groups. Another is the strength of the negative impact of mental illness on employment, with the effect far more pronounced in urban areas as noted.
Table 5.6: Probabilities of being employed among PWD by various characteristics, 2002
| Variable | ALL PWD | Urban male | Urban female | Rural male | Rural female |
| Male | 1.88 *** (0.043) |
- | - | - | - |
| Rural | 0.206*** (0.039) |
- | - | - | - |
| Married | 0.580*** (0.043) |
1.337*** (0.103) |
-0.522*** (0.135) |
1.176*** (0.059) |
-0.073 (0.890) |
| Age | 0.229*** (0.008) |
||||
| SC/ST | 0.132 * (0.038) |
0.044 (0.077) |
|||
| Postgrad. education | 1.000*** (0.191) |
0.940* (0.277) |
1.787*** (0.418) |
0.235 (0.302) |
2.724* (0.792) |
| Disability from birth | 0.425*** (0.040) |
0.298** (0.087) |
0.216 (0.162) |
0.361*** (0.060) |
0.762*** (0.107) |
| Mental illness | -0.789*** (0.102) |
-1.596*** (0.194) |
-1.689*** (0.420) |
-0.614*** (0.115) |
-0.393 (0.311) |
| MR | -1.098*** (0.132) |
-1.098*** (0.132) |
-2.834 (0.763) |
-0.825*** (0.170) |
-1.350*** (0.302) |
| Hearing disability | 1.993*** (0.084) |
1.472*** (0.174) |
0.972*** (0.262) |
2.716*** (0.134) |
1.729*** (0.149) |
| Speech disability | 1.224*** (0.096) |
0.695 (0.165) |
0.827 (0.341) |
1.613*** (0.144) |
0.962*** (0.192) |
| Locomotor disability | 0.817*** (0.067) |
0.848*** (0.104) |
0.771** (0.214) |
0.942*** (0.090) |
0.532** (0.142) |
| Vocational training | 0.394*** (0.097) |
0.224 (0.142) |
0.766 (0.234) |
0.243 (0.151) |
0.825 (0.296) |
| Received govt. aid | -0.179* (0.052) |
*** = statistically significant at 1% level;** = significant at 5% level; * = significant at the 10% level. Standard deviations in parentheses. Source: Mitra and Sambamoorthi (2005)
A more aggregated way to explore the impacts of disability on employment probability is to analyze the marginal impact of having a disability on employment. This is presented in Table 5.7 for rural UP and TN, showing the marginal impact on the probability of being employed by state, gender and severity of disability. Having a disability reduces the probability of being employed by 31 percent for males in rural Uttar Pradesh, and 32 percent for males in rural Tamil Nadu. In contrast, it reduces the probability of being employed only 0.5 percent for rural females in Uttar Pradesh and by 11 percent for females in rural Tamil Nadu. The impact of having a severe disability on probability of being employed is even larger for all groups except TN males.{mospagebreak}
Table 5.7: The marginal effect of disability on employment probability is high for men, lower for women and higher for those with more severe disabilities
| Males | Females | |||
| UP | TN | UP | TN | |
| Marginal effect of being disabled | -31% | -32% | -0.5% | -11% |
| Marginal effect of being severely disabled. | -37% | -32% | -14% | -13% |
Source: Mitra and Sambamoorthi (2005) based on VDS.
For males in the survey, a decomposition of the employment rate gap between disabled and non-disabled men was also carried out. This provides insights into how much of the differences in employment rate can be explained by observable characteristics (e.g. demographic; educational etc), and how much remains unexplained (and typically attributed to discrimination in the case of people with disabilities). Overall, employment rates among disabled men were almost 30 and over 14 percent lower for disabled than non-disabled men in UP and TN respectively. Decomposition of the factors driving the gap found that most of the employment gap is not attributable to observable differences in demographic, human capital or other characteristics. This suggests that there is discrimination against males with disabilities in employment opportunities. While there may be other unobservable factors at play, the results are consistent with survey and qualitative findings on negative attitudes towards people with disabilities and employment prospects in the UP and TN survey, which are discussed in detail in Chapter 2.
Summary of employment profile of people with disabilities:
Some of the main conclusions of the preceding analysis are:
- people with disabilities are substantially less likely to be working than other people. However, the extent of the differences vary sharply by disability type, with those with mental illness, mental retardation and visual impairments the most disadvantaged.
- the gap in employment between disabled and non-disabled people has increased over the 1990s, which is a cause of major concern.
- people with disabilities appear to face different obstacles to employment according to their gender and to whether they live in rural or urban areas. This heterogeneity has important implications for policy and program design, as one size is unlikely to fit all.
- for the most part, education has a limited effect on the probability of being employed for people with disabilities
- it appears that observable characteristics of disabled people do not explain most of their “employment deficit”, but rather than other factors – including discrimination – are driving their poor employment outcomes
- having disabled family members has significant impacts on the employment behaviour of other adult members, both in terms of whether or not the men in the house work and in how much work all other adults are able to do.
Interventions to promote employment among PWD
It is clear from the previous section that the employment situation of PWD in India is a cause of serious concern. In response, the PWD Act and other government initiatives attempt to introduce a range of interventions which are intended to promote employment and enhance the skills of PWD. These include public sector employment reservations, reservations in various anti-poverty schemes such as public works and targeted credit programs, active employment programs, and dedicated credit institutions for PWD. On paper, it is an impressive array of public interventions. However, the Government’s most recent assessment of the interventions for the period 1998-2003 is generally critical of what has been delivered to date, and the cost effectiveness of a number of interventions. 10 Apart from the public sector, there is significant activity by the non-government sector to promote PWD skills and employment, some with public financial support, though the bulk without. This section examines the major public interventions, and looks selectively at NGO interventions.
(i) Interventions to promote employment and skills of PWD:
The main interventions to promote PWD employment covered in this section are:
- public sector employment reservations
- incentives for private sector hiring of PWD
- Special Employment Exchanges for PWD
- National Handicapped Finance and Development Corporation (NHFDC)
- Vocational Rehabilitation Centres (VRCs) under the Ministry of Labour for PWD.
- NGO vocational training initiatives.
(a) Public sector employment reservations: As noted in Chapter 7, the PWD Act provides for a 3 percent reservation in “identified posts” for PWD. The posts were meant to have been identified soon after the Act coming into force and updated every 3 years. The initial identification of posts at the central Government level was not completed until 2001 and no formal expansion of identified posts has been completed subsequently. Among states, as of end 2003, a significant number had failed to identify posts in state services for PWD (e.g. Jharkhand, Gujarat, Orissa and Chhattisgarh), with some of them not even having adopted as policy the reservation system of the PWD Act. Others had identified posts only partially (e.g. UP and TN had identified only group C and D posts). The Commissioner’s office is required to monitor implementation of reservations. However, despite circulation of a reporting format in 2002, the reporting system remains years out of date, leading the CAG to conclude that the system of reservations “was not being effectively monitored” as of 2004. It appears that the situation has not improved significantly in the intervening period.
As per data available in 2003 (Table 5.8), only 10.2 percent of all posts in ministries/departments and public establishments had been identified as suitable for PWD. Among that 10 percent of posts, 3.5 percent for ministries and departments and 4.4 percent for public establishments had been filled by PWD employees. While the 3 percent quota has been met in the strict terms of the Act, the share of PWD in all posts remains negligible, at 0.44 percent, or around one fifth the share of PWD in the overall population as per census estimates. In the case of public establishments, an earlier dedicated survey among large establishments had indicated that around 0.5 percent of employees in 1999 were PWD, suggesting that there had been little progress between then and 2002 in increasing the share of PWD employees.
A second feature of the quota policy is that it applies only to three disability types – locomotor, visual and hearing, with a 1 percent reservation for each. Thus even the disability categories of the Act are not all included in the reservation policy, let alone a range of other disabilities. In its current form, the public employment quota for PWD has succeeded on its own narrowly defined terms. It does not, however, appear to have promoted the broader objective of representation of PWD in the public sector workforce which is commensurate with their population share. Indeed, one may question whether the legislated notion of requiring identification of posts may actually have been counter-productive in terms of facilitating public employment of PWD. The core problem in both principle and bureaucratic practice has been the requirement of specific post identification. In principle, such an approach is hard to defend, as it implies that PWD are not generally competent people.{mospagebreak}
Table 5.8: Reserved posts for PWD identified and filled, early 2000s
| Group of posts | All posts | Posts identified for PWD |
Employed PWD | % identified posts filled by PWD | % all posts filled by PWD |
| Ministries and Deparments | |||||
| A | 57,643 | 4,305 | 134 | 3.11% | 0.23% |
| B | 73,851 | 4,652 | 205 | 4.41% | 0.28% |
| C | 1,607,243 | 167,863 | 6,307 | 3.76% | 0.39% |
| D | 960,025 | 104,578 | 3,329 | 3.18% | 0.35% |
| Total | 2,698,762 | 281,398 | 9,975 | 3.54% | 0.37% |
| Public Establishments | |||||
| A | 204,127 | 18,244 | 508 | 2.78% | 0.25% |
| B | 175,159 | 14,350 | 1,226 | 8.54% | 0.70% |
| C | 1,013,917 | 89,789 | 4,525 | 5.04% | 0.45% |
| D | 435,328 | 56,615 | 3,819 | 6.75% | 0.88% |
| Total | 1,828,531 | 178,998 | 10,078 | 5.63% | 0.55% |
| All | |||||
| Total | 4,527,293 | 460,396 | 20,053 | 4.36% | 0.44% |
Source: DOPT. Ministries and Departments was reported for 59 M and D in 1/2003 for posts as of 1/2000. The information on public establishments was reported for 237 public establishments in July 2002.
A broader question which the reservation policy raises is how consistent it is with good international practice in promoting employment of PWD. Box 5.1 below summarizes experience with public employment quotas for PWD internationally. Overall, many countries have such quotas (e.g. over one third of OECD countries) but the experience in both developing and developed countries has been rather poor, and the trend in developed countries is away from quota-based approaches towards accommodative workplaces. Some of these experiences may hold lessons for India, though it is acknowledged that the culture of public employment reservations is unusually strong. However, even within a quota-based system, there is great scope to have more PWD-promoting employment and procurement policies, as the example of NTPC in Box 5.2 demonstrates.
Even if the quota system is retained, there is significant scope to improve it. The most obvious way to expand the scope of the PWD reservation would be to drop the requirement of identifying posts and use as a denominator for the quota the number of all posts in the public service. The list of identified jobs is very restrictive and often arbitrary (e.g. in Group A, the job of an agricultural scientist specialized in econometric analysis is identified as being suitable for an individual who is blind or has an orthopedic disability, but not for someone with a hearing disability). The list of identified jobs is based on the assumption that the characteristics of an impairment are the exclusive determinants of an individual’s ability to hold a position at a particular skill level and thus ignores the potential influences of individual characteristics (motivation, age at disability onset), access to employment services, and the characteristics of the workplace and labor market.
|
Box 5.1: International Experience with Quotas for PWD employment
Quota systems to promote employment of PWD are used in many countries in both industrialized and developing countries. Typically, quotas are not formulated as a percentage of identified posts as in India but in terms of the proportion of all employees who have disabilities. Usually employers with a minimum number of employees - both in the private and public sector - have to fulfill the quotas.
The main variant of the straight quota system is the so-called “quota-levy” system, whereby employers can pay a contribution to an earmarked fund in lieu of employing PWD up to their quota obligation. The funds are used for purposes such as payments to employers for accommodating PWD in the workplace, direct payments to workers with disabilities, and payments to disability service providers. Such a system operates in a number of OECD and transition countries (Mont, 2004; Thornton, 1998). Quota fulfillment for PWD employment is generally low, between 50 and 70 percent even in developed countries (OECD (2003). In Africa and Asia, quotas are often not enforced (Mont, 2004). A recent study of the European Commission on quota systems in 18 industrialized countries summarized in O’Reilley, (2003) did not find one example of a country that meets its quota target, leading the authors to conclude that “in most countries, the tide is swinging away from quotas – either for their total abandonment (as in the UK), or for other measures (active employment support for individuals or stronger discrimination laws)”. Overall, the trend in Europe is towards a PWD employment promotion approach that relies on anti-discrimination legislation, which is an approach used in a number of Anglo-Saxon countries such as USA, Canada and Australia for some time. |
Private sector employment incentives: For the private sector, the PWD Act makes provision for a subsequent incentives policy to be put in place, with a target of 5 percent of the private sector workforce being PWD. This provides an interesting contrast between the approach for the private and public sectors in the Act, in that the former takes a “whole of workforce” approach, whereas the public sector “share of identified portion of workforce” approach. It seems that an incentives-based approach has more potential with respect to the private sector, where quotas would be unenforceable and possibly undesirable.
However, neither GoI nor states have subsequently introduced a general incentives policy to promote employment of PWD in the private sector. At the same time, in the 2007-08 budget, GoI has introduced a specific incentive program for the formal private sector. This would provide a waiver on social security contributions for certified disabled employees for 3 years on their ESI and EPFO contributions, a not-insignificant subsidy.14 The details of the program are still to be worked out, and of course would not apply to the unorganized sector. The FM’s budget speech indicates a target of 100,000 PWD with a salary limit of Rs. 25,000 per month, with an initial estimated cost of Rs. 150 crore annually, rising to Rs. 450 crore when rolled out.
Nonetheless, there has been useful work done through combined NGO/industry efforts which has developed a draft incentives policy for employment of PWD in the private sector. The proposal focuses primarily on incentives related to corporate income tax, service tax and excise, import duties and VAT on capital expenditures. It has not, however, to date been costed, nor a system of monitoring to minimize abuses proposed. Given the nature of incentives proposed, it would clearly apply only to the organized private sector.
|
Box 5.2: National Thermal Power Corporation Limited (NTPC) is setting an example in the public sector
NTPC, a public sector company incorporated in 1975 is now the largest power generating company in India with an annual turnover of 259642 million rupees with total staff strength of 23,519 people. Since 2001, NTPC has placed disability on their corporate social responsibility agenda. A two phase targeted recruitment strategy was implemented to recruit people with disabilities into the government identified posts. In the first phase of recruitment, NTPC received 50,000 applicants from disabled candidates for 126 jobs. Following a second phase of recruitment, a total of 387 persons with orthopaedic, visual and hearing disabilities have found jobs at NTPC. This equates to 1.65 percent of total staff, not yet in accordance with the 3 percent reservation. NTPC has continued to revise and expand their own job lists for persons with disabilities and have currently 71 types of posts which are considered suitable. All staff salaries are defined on the basis of the salary framework with no difference between disabled and non disabled employees, existing disabled employees’ salaries range from Rs 8500 to Rs 44000. As the government quota does not cover employment of persons with mental handicaps, NTPC has chosen to outsource 50 percent of its total requirement for office envelopes and file covers (with a value of 5 lakhs) to NGOs, two of which work with mental handicaps (Muskan and Action for Ability Development and Inclusion). When in need of miscellaneous products such as conference bags and greeting cards, NTPC also frequently outsources these through NGOs working with PWD. With a slowing rate of job growth within NTPC and the organised sector generally, NTPC has also developed other initiatives to increase employment opportunities for PWD. Seventeen crores of the company profits have been allocated towards identifying and supporting innovative schemes which develop vocational skill and sustainable employment opportunities for persons who are visually or hearing impaired. NTPC also realises that social rehabilitation is a necessary adjunct to economic rehabilitation and supports a wide range of initiatives such as medical camps, and provision of aides and appliances. Source: Officer (2005) |
Previous work suggests that employment of PWD among large private firms was negligible at the end of the 1990s, with only 0.3 percent of the private firm workforce being PWD. Among multinational companies, the situation was far worse, with only 0.05 percent of their workforce being PWD. Even more interestingly, the situation with respect to PWD hiring faces challenges even in the NGO sector. A study in the late 1990s found that, even in NGOs working in the disability sector, only 14 percent of jobs were occupied by PWD, and none of the surveyed NGOs had an explicit affirmative action policy in hiring. More recently, a survey of both mainstream and disability NGOs found that more than half had PWD employees, with around 4 percent of total jobs occupied by PWD.
The generally poor situation with respect to PWD hiring in the organized sector is not to say that there are not a number of private sector firms which have far better performance on PWD hiring. These can be broadly divided into two groups: (i) those which offer employment opportunities for PWD as part of their corporate social responsibility agenda; and (ii) those which are driven by strictly commercial criteria in their hiring of PWD. Of course, the two categories are not exclusive, as CSR-driven hiring may in time be increasingly justified by good business reasons. The case of Titan Industries is a case in point (Box 5.3). With 4 percent of their workforce as PWD, Titan management has found that PWD have greater job loyalty and generally greater focus in their work, with at least equal productivity and quality. This is consistent with survey findings. Nationally, a survey in the six major metros of 120 corporates found that around two thirds of firms employing PWD were completely satisfied with their performance, and not a single company indicated that it was even somewhat dissatisfied.19 In a survey in Orissa, while only 4 percent of firms interviewed reported employing PWD, over 80 percent of those that did considered their PWD employees to be an asset to their organization.
|
Box 5.3: TITAN India shows that employing disabled people makes good business sense
Titan Industries is India’s and one of the world’s largest timepiece manufacturers, grossing approx USD 250 million) last year. In the early 1980s Titan started providing job opportunities for PWD and became one of a handful of Indian enterprises attempting to reverse the job-market bias against workers with disabilities. Currently, persons with disabilities constitute about 4 percent of Titan’s total workforce. This includes 29 employees with physical disabilities, 84 with hearing/speech impairments, and 4 with vision impairments, 12 of whom are women. Titan understood that the watch industry provides several employment opportunities for PWD. Persons with locomotor disabilities worked on polishing watch cases and assembling components, and as machine operators in operations such as sorting, buffing and making ornaments. Persons with hearing impairment were employed to put straps on watch heads, while persons that are visually impaired have found their place in the company’s packaging and despatch division. Titan specifically targeted PWD in their recruitment strategy. Appropriate selection procedures were adopted depending on the nature of the disability. The company arranged counselling sessions with the families, to make the transition into the factory smooth. “Titan was clear that persons with disabilities are an intrinsic part of our society and need understanding, support and opportunities, not charity or misplaced compassion,” says Mamatha Bhat, who has been closely involved with the initiative. Hiring was but one component of Titan’s plan for persons with disabilities: barrier free workspaces were just as important. For example, the provision of handrails provides support to persons with locomotor disabilities walking within the factory. Supervisors who interfaced with the hearing impaired were trained in sign language. Today, in the strapping department, it is nearly impossible to distinguish the hearing impaired from the others, as everyone uses sign language. Coherent with TITAN’s policy of inclusive development, staff with disabilities and their non disabled colleagues work in common areas. Several other steps were taken to build technical competencies and computer literacy of the employees. TITAN worked with a number of NGOs for programmes on awareness creation in the company and personality development for persons with disabilities. TITAN ensured that their HR policies were all non discriminatory, including promotion and ensured effective grievance procedures for all. Employees with disabilities were housed with non disabled employees, which contributed to their integration with the rest of the workforce. Fortnightly meetings sensitised the company about issues concerning PWD and their families. The introduction of employees with disabilities early in the life of the company contributed to their acceptance as equal members of the workforce, promoting cohesion in the working environment. Apart from providing employment and financial independence, PWD at Titan have improved their social standing and boosted their self-esteem. Around 96 of them are married, with Titan playing matchmaker for eight couples. Most own homes in the Titan township and their children study in the best schools. With time, Titan has realised that the disabled members of its family are more loyal and far more focused on the job. Despite the physical limitations of these employees, productivity and quality have never been issues. Titan Industries has shown that recruiting people with disabilities makes good business sense. Source: Officer (2005). |
(c) Employment Exchange Programs for PWD: The Employment Exchanges were established under the Employment Exchanges (Compulsory Notification of Vacancies) Act of 1959. The main functions of employment exchanges are to register and place job seekers, traditionally almost entirely for public sector jobs. As of end-2004, there were 947 Employment exchanges in India. The administration of employment exchanges is with the state or union territory governments. Exchanges are located in urban areas. Most employment exchanges cater to all types of job seekers. Some exchanges are specialized in particular types of job seekers and include the special employment exchanges for the physically handicapped. There are 42 special employment exchanges for PWD nationally. In addition, there are 38 special cells for persons with disabilities in the regular employment exchanges where a special placement officer is attached. PWD may also be registered with regular exchanges.
Generally, the enforcement of the Act is limited outside the public sector, with very few private establishments reporting vacancies to the exchanges. The link between employment exchanges and establishments in the private sector seems to be overall quite weak, including linkages between exchanges and NGOs active in promoting skill development and employment for PWD. One exception is the special exchange in Chennai where a private sector placement campaign is run in addition to its efforts to place registrants in public sector jobs. As part of this campaign, private sector establishments are being contacted by the special exchange by phone, mail or in person for the placement of persons with disabilities and the special exchange holds a job fair every two weeks with private employers.
The majority of PWD clients of employment exchanges use regular exchanges. Only 27 percent of PWD registered with special exchanges, or the special cells of regular exchanges. Among the total 661,000 PWD on the live register of all exchanges, 109,929 were registered as part of special exchanges for physically handicapped and 66,612 were registered as part of special cells for physically handicapped of regular exchanges. Total funding for special exchanges and cells between 1998 and 2003 was just over Rs. 5 crore.
What is the impact of the employment exchanges for PWD ? There has not been any comprehensive evaluation of special employment exchanges. Table 5.9 gives the numbers of PWD registering, being placed and on the live register of the special employment exchanges and other exchanges from 1994 through 2003. It is clear that the placement ratio is very low for both the special exchanges and other exchanges, 0.9 percent and 0.7 percent respectively in 2003. While performance among special exchanges in different states is quite variable in relative terms, the highest placement rate (Vadodara) was still under 6 percent in 2003, with the ten worst performing special exchanges placing only 4 people in employment that entire year. Just as importantly, the placement ratio has roughly halved over the past decade in both cases, from close to 2 percent and 1.2 percent in 1994 for special and other exchanges respectively. This downward trend probably reflects shrinking job opportunities in the public sector, and the general failure of exchanges to reach out to private employers.
Table 5.9: PWD placed by employment exchanges are very low and placement rates have halved over the past decade (in thousands)
| Registrations | Placements | Live Register | Placement ratio | |
| Special Employment Exchanges | ||||
| 1994 | 8.4 | 1.3 | 67.1 | 1.94% |
| 1999 | 15.1 | 1.3 | 96.2 | 1.35% |
| 2000 | 14.8 | 1 | 101.1 | 0.99% |
| 2001 | 12 | 1.1 | 107.8 | 1.02% |
| 2002 | 11.6 | 1 | 110.6 | 0.90% |
| 2003 | 10.9 | 1 | 109.9 | 0.91% |
| Other Exchanges | ||||
| 1994 | 35.3 | 3.2 | 273.2 | 1.17% |
| 1999 | 47.6 | 2.9 | 359.7 | 0.81% |
| 2000 | 49.9 | 2.3 | 384.1 | 0.60% |
| 2001 | 48.1 | 2.4 | 402.2 | 0.60% |
| 2002 | 47.8 | 2.4 | 422.1 | 0.57% |
| 2003 | 55.2 | 3.9 | 551.8 | 0.71% |
Source: GoI (2005).
The number of PWD placed as part of regular exchanges is not reported, but we can grossly estimate the total PWD placed through all exchanges. PWD represent 1.6 percent of the total live register of all exchanges, or around 662,000 are registered with employment exchanges. If we assume that 1.6 percent of all placements of all exchanges (154,900 in 2003) are PWD, then around 2,500 PWD were placed in 2003 through all employment exchanges. This is clearly negligible, and made more so by evidence of earlier studies that found that around one third of registered exchange clients were already employed and around 12 percent pursuing studies, so that the net employment effect of exchanges appears even lower than gross placement figures would suggest.
It seems clear that employment exchanges – both special and regular – play a negligible role in promoting employment among PWD. Moreover, the cost effectiveness of many special exchanges is open to question. Even at an average level, the approximate per unit cost of a placement by the special exchanges in 1998-2003 appears to be over Rs. 7,500. This is not a specific fault of special exchanges, but rather reflects a range of fundamental shortcomings in the employment exchange model in India. Even supporters of exchanges acknowledge that failure to undertake major reorientation of employment exchange activities will result in their increasing marginalization as a source of employment, both for PWD and the non-disabled population (e.g. increasing outreach to the private sector; proposing job seekers to employers on the basis of suitability and not merely length of time on the register as presently). A second general issue is the urban focus of exchanges and the need to develop cost-effective rural outreach and informational strategies if they are to be relevant to the bulk of the PWD labor force. The weakness of rural outreach can be seen from the UP and TN survey, which found that 85 percent of respondents were not aware of the existence of exchanges, and only around 1 percent had actually benefited from their services. A final question with respect to special exchanges is whether they should be entirely mainstreamed, as current demand patterns suggest that regular exchanges are in any event servicing the bulk of PWD clients. An alternative may be to use the current special exchange and cell allocations to fund NGO employment promotion activities, which appear to be more innovative and effective (see Box 5.4). There is nothing to say that public sector employment services can not innovate and develop direct contacts with private industry, as the TN Special Exchange experience shows. However, it seems clear from official statistics that many exchanges are very passive, and that the option of working with the NGO sector in employment service activities could be explored.
|
Box 5.4: A Jobs Fair Bringing Employers and Disabled people Together for Mutual Benefits.
The Ability Foundation in Chennai ran an “EmployABILITY job fair” in 2004 and 2005. Seven hundred (60 percent women and 40 percent men) highly qualified disabled people (MBA, MCS, Software engineers etc) were introduced to the HR representatives of 32 leading IT/ ITES companies. The EmployABILITY fair gave disabled job seekers an important opportunity to meet face to face and discuss with employers, display their job skills and make an explicit demand that they be hired on merit alone. In one instance there were 45 persons with disabilities who had the right IT skills for one company. In this one day 70 persons with disabilities got jobs. Persons with disabilities felt very positive about getting interviews and reported that it helped them
Source: Officer (2005) |
(d) Promoting Self-Employment through the NHFDC: GoI incorporated the National Handicapped Finance and Development Corporation (NHFDC) in 1997 in order to help entrepreneurs with disabilities through financial assistance. NHFDC provides loans to PWD to support a variety of activities: small businesses in the service sector, the purchase of vehicles for commercial activity, small industrial units, agricultural activities, education and training, and self-employment for persons with mental retardation, cerebral palsy and autism.
NHFDC does not have its own branches to implement schemes, and instead uses State Channelizing Agencies (SCA), non-governmental organizations and in rare cases, commercial banks. Loan default risk is entirely born by the implementing agencies, with SCAs, NGOs and banks having to pay 100 percent of the loan amount back to NHFDC. The rate of loan recovery is usually above 70 percent. SCA account for most of the financial assistance provided by NHFDC. In most States, the SCA was already in place to implement the schemes for the SC, ST, and other economically weaker sections, and has been given the additional responsibility to implement NHFDC schemes. NHFDC delegates the power to sanction loans up to Rs. 1 lakh to the SCA and the loan money reaches the beneficiary through the SCA.
As shown in Table 5.10, between 1997 and 2005, the number of NHFDC beneficiaries has been very low. The number of beneficiaries in the period was 19,643. There is considerable variation across states in the number of beneficiaries, with states like Bihar and UP having very low coverage (9 and 6 beneficiaries respectively). In addition, disbursements have been very low, ranging between 23 and 26 percent of available funds in 1997-2002, in part due to long lags between receipt of funds by SCAs and loan disbursement. 29 In addition, even among the small client base, there is a strong gender and disability bias. Over 80 percent of beneficiaries are men and nearly 90 percent of the beneficiaries of schemes are persons with orthopaedic disabilities. The impact of the scheme is dependent on whether the State gives priority to disability issues and on the competence and initiative of the SCA. It is clear that disbursement is driven by institutional factors rather than size of disabled population, weakness in credit markets, etc.
Table 5.10: Beneficiaries sanctioned and disbursements, NHFDC schemes, 1997-March 2005
| Beneficiaries | Disbursed (Lakh Rs.) | |
| AP | 602 | 269.5 |
| Assam * | 20 | 2.0 |
| Bihar * | 9 | 0.5 |
| Chattisgarh | 136 | 71.2 |
| Gujarat | 1231 | 550.7 |
| Haryana | 2831 | 1183.5 |
| HP | 294 | 214.4 |
| Karnataka | 1177 | 246.6 |
| Kerala | 1022 | 655.7 |
| MP | 1996 | 841.2 |
| Maharashtra | 2716 | 1636.2 |
| Nagaland | 499 | 242.6 |
| Orissa | 2237 | 935.7 |
| Punjab | 42 | 8.8 |
| Rajasthan | 2211 | 1264.8 |
| TN | 274 | 84.3 |
| Tripura | 25 | 12.3 |
| UP | 6 | 6.4 |
| WB | 582 | 241.3 |
| Chandigarh | 122 | 37.1 |
| Delhi | 406 | 104.7 |
| Pondicherry | 953 | 430.5 |
| Others | 252 | 153.0 |
| Total | 19643 | 9193.0 |
Source: NHFDC website reporting cumulative numbers since inception. * = 2003 figures.{mospagebreak}
NGOs implement the Micro-Finance Scheme of NHFDC. Under the scheme, NHFDC provides a one-time grant of Rs. 10,000 to the NGO to cover start up costs for the scheme. The NGO may receive from NHFDC a loan of up to Rs. 5 lakhs for disbursement to beneficiaries (up to Rs. 25,000 per person). The beneficiary is charged a rate of interest of 5 percent, of which 3 percentage points is for the NGO to meet administrative costs and 2 points is for NHFDC. In order to obtain the loan, the NGO has to provide security to NHFDC in the form of 25 percent of the sanctioned amount as fixed deposits or 40 percent of the amount as collateral security.
The size of NHFDC’s micro-finance scheme though NGOs is insignificant. As of early 2003, 132 NGOs had applied for loans through the scheme, and 57 of them had disbursed loans to 1,365 beneficiaries for an average amount of Rs. 0.08 lakh. In sixteen states, there was no NGO partner as of late 2003. The limited interest by NGOs in the scheme may result from the financial conditions of participation that may be difficult to fulfill, in particular the security requirements and limited support for administrative costs. The administrative costs incurred for the implementation of the Scheme vary greatly depending on the number of beneficiaries and the administrative structure already in place within the NGO. It is likely that the one-time start-up grant of Rs. 10,000 for all NGOs is not sufficient for NGOs who do not have the cashflow to wait until the interest income is recouped.
The involvement of banks is a recent attempt to reach more beneficiaries. The Punjab and Sind Bank was the first bank to take the initiative to implement NHFDC schemes followed by the Oriental Bank of Commerce. It is too early to assess whether the involvement of banks has made it easier for NHFDC to reach more beneficiaries. The challenge for NHFDC is to make its schemes sufficiently attractive financially to get the attention of more commercial banks, and perhaps also to expand its outreach to MFIs and other NBFCs who may have an already developed lending process and client groups. The experience of AP with its Velugu (now IKP) SHGs and micro-financing suggests that non-traditional partners for increasing outreach of NHFDC financing could pay dividends.
(e) Vocational and Apprenticeship Training for PWD: Employment and vocational services are provided to PWD in India through a variety of mainstream and segregated agencies and programs, an overview of which is available in Rungta (2004). GoI provides vocational services to PWD through Vocational Rehabilitation Centres (VRCs), first established in 1968 under the Ministry of Labour. The basic model is a PPP one of contracting out to NGO service providers. There are currently 17 VRCs located in state capitals and the Government plans to support seven more. The main tasks of VRCs are to make vocational assessments of PWD and to provide short term training that lasts a year. Some VRCs also provide job placement services. In addition, some VRCs have rural rehabilitation extension centers whereby mobile rehabilitation counselors have disability assessment camps periodically and may organize Community Based Rehabilitation (CBR) in partnership with NGOs. There are 11 rural rehabilitation extension centers.
VRCs provide informal training to PWD who do not have the necessary education to enter formal training institutes such as Industrial Training Institutes (ITIs) or Polytechnics. There is no educational pre-requisite for eligibility and entry is allowed any time of year. Training is unstructured or semi-structured and is imparted in various trades, including: metal (welding and turning), carpentry, radio and electronic equipment services, tailoring, appliance repair, tricycle assembly and commercial education. Commercial education may include computer training. VRC clients may be rehabilitated in jobs or self employment.
Working age leprosy cured persons and persons with visual, hearing, locomotor disabilities or mild mental retardation may be eligible to receive VRC services. Many PWD are excluded from VRCs, e.g. persons with mental illness are not eligible and residential rules may exclude certain segments of the population with disabilities. For instance, the VRC in Chennai provides residential accommodation only to males, and is thus likely to exclude females with disabilities who live in rural Tamil Nadu. In 2004, persons with locomotor disabilities accounted for more than 80 percent of the persons admitted into VRCs, with persons with visual and hearing disabilities accounting for the bulk of the remainder.
VRCs generally do not seem to make any regular effort to update the skills imparted along shifts in labor demand. There is a need to identify obsolete courses and substitute them with new ones. In addition, there seems to be a lack of focus on placement. Little effort is dedicated to ensuring that clients secure and maintain employment.
Like other active labor programs for PWD, the size of the VRC program is very small, rehabilitating only about 10,500 persons a year. To our knowledge, there is no study that shows that VRC training improved the job prospects and earnings of those who were trained in VRCs compared to those who did not receive the training. There are also limited data on the extent to which participants sustained gainful employment following VRC training. Participants are not followed over a number of years to identify the long term effects of the VRC training. In 2004, 29,124 clients were accepted into VRCs, and 10,490 were rehabilitated.
Another scheme run by the Ministry of Labour is the Apprenticeship Training Scheme. This provides opportunities for ITI graduates to upgrade their skills through on-the-job training in industrial settings. It is obligatory, under the Apprentices Act (1961) for employers in the public and private sectors to engage apprentices. The Act covers 254 groups of industries. There is a reservation for people with disabilities under the scheme (3 per cent), but the same remains seriously under-utilized. In 2001, 559 persons with disabilities underwent apprenticeship training which equates to 0.03 percent utilization. There were no figures for 2004-5.
(f) Non-Governmental Employment Promotion Initiatives: As seen above, the penetration of public sector employment and skill promotion initiatives has been very limited in the decade since passage of the PWD Act. At the same time, a gradually expanding number of NGOs have become active in either vocational training of PWD or direct employment generation. Survey evidence from the late 1990s indicated that around two thirds of disability NGOs were conducting vocational training, and just under 60 percent producing some aids and appliances. Of the 700 NGOs receiving grant-in-aid funding for disability in 2004-05, 190 of them were operating vocational training courses for PWD. The majority of these were informal, with no accreditation process. The bulk of them were oriented towards skills for sheltered, group and self-employment rather than for employees in the organized sector. In addition, there was an emphasis in both vocational and employment programs of NGOs on designated activities for PWD, the bulk of which are traditional crafts (e.g. re-caning of chairs, chalk making, book binding etc), which attract relatively low wages of around Rs.500-1200 per month.
|
Box 5.5: Good practice in NGO skills training and employment promotion for people with disabilities:
The NGO sector has shown considerable innovation and impact in skill development and employment promotion of people with disabilities. Two notable cases are: WORTH TRUST in Chennai has operated training centres and several production centres since the 1960s for people with disabilities, initially focusing on people with leprosy. Training takes two forms: (i) formal 2 year training with government syllabus and certification; and (ii) informal 2 year training fro those who have not finished high school without certification. Both include on-the-job training as well as classroom and workshop sessions. Both focus on jobs as machinists, electronics, welding and other skills. Its producton centres have evolved with market demand metal items to fabricated plastic precision parts, as well as assistive devices. Two of the five centres have ISO 9002 certification. It also provides hosing loans, and counseling for trainees seeking jobs. Its own impact evaluation in 2000 revealed good employment outcomes, with around 80 percent of trainees in jobs, primarily in factories. Some innoviatve features of WORTH’s work include: (i) regular monitoring of labor and product market demand, based on which it has changed its course content and focus of production over time; (ii) the counsellign function has been critical to improving the skills of trainees to access open employment; (iii) it ensured that its production centres were located near their markets to improve competitiveness; (iv) it provides training of trainer for similar operations in India and abroad; and (v) it is one of the few NGO or public training institutions for disabled people that has properly monitored the employment outcomes of its trainees. The Thakur Hari Prasas Institute was established in 1968 in Hyderabad, initially as a rehabilitation centre for children with mental disabilities. This work has continued and expanded, but the most innovative element of its activities is its Community-Based Rural Project started in 1992. It has mobile project teams which work with communities initially to identify and then to educate and/or train young people with intellectual disabilities. This can include integration into regular schools for those under 15, home-based skills training for the more severely impaired, and placement in local jobs with on-site training for those over 15. The trades covered included agriculture, carpentry, welding, nursery, and blacksmithing. The teams also identify community members who can assist in training under supervision. The strong involvement of communities has been a key to its success. There has been considerable success in getting the children with intellectual impairments into work, with bulk of trainees now employed full time. Source: ILO (2003) |
NGO skills training programs exhibit a range of experiences. However, several common elements can be observed. These include:
- skills, where more informal passing on of knowledge may occur in many occupations. Despite this, there are useful examples like Jai Bharat NGO in rural Rajasthan which pairs disability-trained community workers with local resource persons with desired skills (e.g. rope or shoe making) to provide informal training in a manner that is suited to rural PWD. There have been concerns expressed of rural PWD being brought to urban areas for training, with problems of resocialization and actual demands for skills taught. 34 Equally, placement rates in urban areas of rural trainees have tended to be low.
- many NGOs acknowledge a lack of trained trainers. While rehabilitation specialists are relatively easy to identify, NGOs note the shortage of professionals with PWD-specific and vocational skills, with only one of the national institutes providing training in VET.
- as in the public sector, NGOs frequently failed to undertake sufficient assessment of the local labor market conditions in determining courses for PWD. This is in part due to the tradition of a limited range of craft-based skills, and in part lack of pressure from funders for market-relevant training. Nonetheless, the better NGOs are increasingly reaching out directly to the private sector to assess need, in the best cases through local market assessment which have proved very effective, as the case of DISHA from Rajasthan shows (see Box 5.6).
- monitoring of employment and wage outcomes for PWD trainees tends not to happen. Of course, full-blown M and E may be costly, but more structured attempts to get employment outcomes would act as a key indicator of local demand. There are, however, good practice examples like the WORTH Trust who have conducted serious survey-based monitoring of both employment and wage outcomes of their trainees.
- there is limited effort to promote integrated training of PWD and non-PWD, and limited cross-disability training even among people with disabilities. There will be cases where segregated training is preferred by PWD. However, as it is often perceptions of employers and other non-PWD workers in the market that contribute to poor LM outcomes for PWD, efforts to promote more integrated training would be worth pursuing where feasible.
- women tend to be seriously under-represented in vocational training. This is driven by a range of factors, including training offered and its male bias in many cases, lack of suitable accommodation for PWD women in residential courses, low household expectations for PWD women etc.
- on the job training in firms outside the NGO itself is to date very under-developed.
The above points indicate that there remains considerable scope for adjusting the skill development and employment promotion activities of NGOs. However, there is also evidence of considerable innovation and dynamism in the NGO sector which is largely lacking in the public sector interventions to date. The most successful operations in the NGO sector appear not only to be achieving better labor market outcomes than any of the public sector interventions, but also to be flexible enough to adapt their product lines and methods to changing market conditions. It is not possible to provide a comprehensive overview of such successes, but the examples of the WORTH Trust in Tamil Nadu (see Box 5.5), the Indian Institute of Cerebral Palsy in Kolkata, and a public-private partnership in Mumbai indicate the success and capacity of NGO institutions to engage effectively with the private sector to promote good outcome for their PWD clients.
|
Box 5.6: Knowing your Market: DISHA
DISHA, a local NGO in Jaipur, carried out a study on 16 types of industries to have a better understanding of local employment opportunities and assess skill development needs for adolescents and adults with mental handicaps, autism and cerebral palsy. The study enabled DISHA to identify 18 potential areas for job placement and gain a better understanding of local employers’ concerns and potential barriers to employment of PWD. Employers also provided suggestions on resources for training which reduced the need to develop in-house expertise. The results formed the basis for decisions on the skill development courses they would provide in their vocational training unit i.e. cooking, crafts, silver jewellery, block printing, recycling unit. The investment in understanding the market both for products and jobs has had multiple effects. It has helped bring DISHA closer to employers and hence be in a better position to support job placement of persons with mental handicaps in their companies. It has helped DISHA target job opportunities for persons with mental handicaps in industries where they are seldom seen i.e. Five star hotels, edible product manufacturing units and fabric printing units. It has diversified the training options for persons with disabilities which continue to evolve on the basis of market demand i.e. initially they produced biscuits for sale to hotels now with greater interest in “different types of bread” they are venturing into bread production. Source: Officer (2005). |
Conclusions and recommendations
It is clear from the review of active labor policies in the public sector and private interventions that there are no magic solutions to the poor employment outcomes of PWD. Improving employment outcomes for people with disabilities starts with the education system and community attitudes. Public interventions have achieved minimal coverage over a sustained period, with no signs of significant improvement. There are relative out-performers by state under different programs, but even those achieve low outcomes in absolute terms. NGO programs face inherent challenges of scale and often need stronger linkage to the labor market to improve impact. Several recommendations emerge from the analysis:
Improving public sector employment practices. First, the reservation for disabled workers needs to be reviewed and reformed. If a quota approach is retained, it should be based on a share of all posts in public agencies and discontinue the practice of “identified posts”. The Government should also review whether special employment exchanges should be integrated into the regular exchange network. In either event, there must be a systematic engagement with the private sector to assess labor market demand and move away from the current focus on public sector employment. TN and Gujarat provide promising models in this regard. Awareness campaigns for public programs are needed, as knowledge about available programs remains low.
Improving quality of private sector initiatives, and strengthening public-private partnerships. GoI and the NGO and private sectors should jointly review the draft private sector incentives policy for people with disabilities developed by NCPEDP and FIICI to assess its financial and administrative feasibility and adopt those measures deemed workable into policy. There should be dissemination by the Commissioners’ offices of good practice in public and private sector enterprises in hiring and promotion of inclusive workplaces for people with disabilities. In particular, a review of the impact and viability of NHFDC should be carried out. At a minimum, the structure of NHFDC schemes needs to be revised so as to give SCAs, NGOs and banks better incentives to participate, and accountability mechanisms for channelling agencies improved. There should also be more experimentation with group-based lending to disability SHGs, which has been shown in states like AP (and in mainstream targeted credit programs) to be more effective than individual lending in expanding credit coverage.
Increasing outreach to marginalized groups and regions. Both public and NGO training for disabled people needs to make greater efforts to include women with disabilities and a broader range of disabilities. They also need to develop simple processes for regular assessment of labor market demand. Pilot interventions for rural outreach of both public and NGO active labor programs are needed, and public funds from existing programs should be dedicated to this purpose. This will require much stronger engagement with communities and SHGs of disabled people.